Download
1 / 9
90 likes | 220 Vues
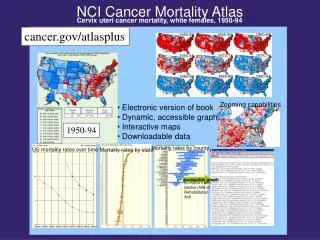
1950-54. 1955-59. 1960-64. 1965-69. 1970-74. 1975-79. Zooming capabilities. 1980-84. 1985-89. 1990-94. Mortality rates by state. Mortality rates by county. accessible graph. (compliant with Section 508 of Rehabilitation Act). NCI Cancer Mortality Atlas.

E N D
1950-54 1955-59 1960-64 1965-69 1970-74 1975-79 Zooming capabilities 1980-84 1985-89 1990-94 Mortality rates by state Mortality rates by county accessible graph (compliant with Section 508 of Rehabilitation Act) NCI Cancer Mortality Atlas Cervix uteri cancer mortality, white females, 1950-94 cancer.gov/atlasplus • Electronic version of book • Dynamic, accessible graphs • Interactive maps • Downloadable data 1950-94 US mortality rates over time
-------------------------------------------------------------------------------------------------------------------------------------------------------------------- Analisi della mortalita' per TUTTI I TUMORI ANNI 1995-2001 del cerchio con centroide ALANNO comuni del cerchio 101 raggio del cerchio 29 Km ---------------------------------------------------------------------------------- Frequenze complessive dei soli comuni compresi nell'area: VAL PESCARA Deceduti Totale Popolaz. per causa deceduti media nel periodo nel periodo annua Uomini nativi 2637 9078 -- Donne native 1769 8083 -- Uomini migranti 489 1481 -- Donne migranti 370 1478 -- ---------------------------------------------------------------------------------- Uomini totale 3126 10559 145766 Donne totale 2139 9561 154537 ---------------------------------------------------------------------------------- Deceduti Deceduti Deceduti Deceduti Deceduti comuni comuni provincia regione area cerchio centroide centroide nazione Uomini nativi Proporz. grezza x100 29.05 28.52 29.02 28.52 32.00 Prop. st. ind. x100 22.56 22.38 22.50 22.49 23.91 S.P.M.R. x100 103.55 102.69 103.28 103.23 109.72 Uomini migranti Proporz. grezza x100 33.02 31.66 33.50 31.32 34.18 Prop. st. ind. x100 24.76 23.74 25.05 23.15 24.74 S.P.M.R. x100 113.63 108.94 114.95 106.23 113.54 Uomini totale Proporz. grezza x100 29.61 28.91 29.64 28.81 32.41 Prop. st. ind. x100 22.88 22.55 22.87 22.56 24.07 S.P.M.R. x100 105.01 103.49 104.97 103.56 110.46 tasso grezzo an. x10000 30.64 30.95 30.91 30.77 32.85 tas. st.ind. an. x10000 41.69 40.69 41.04 39.54 46.75 S.M.R. x100 202.39 197.54 199.23 191.93 226.93 tasso st.dir an. x10000 43.09 42.04 42.04 39.76 47.05 errore stand. x10000 0.81 0.64 0.79 0.35 0.06 C.M.F. x100 209.15 204.07 204.10 192.99 228.39 tasso EUROP. an. x10000 73.64 104.23 42.01 42.73 52.72