National Cancer E-atlas
100 likes | 279 Vues
- Easy Access to Cancer Statistics for E veryone. National Cancer E-atlas. Introduction to e-atlases Look at the cancer e-atlas as it is at the moment What changes have been made to new e-atlas Sneak preview of what the new atlas can do Scenarios – audience participation required!. The plan.

National Cancer E-atlas
E N D
Presentation Transcript
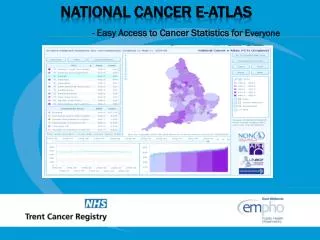
- Easy Access to Cancer Statistics for Everyone National Cancer E-atlas
Introduction to e-atlases Look at the cancer e-atlas as it is at the moment What changes have been made to new e-atlas Sneak preview of what the new atlas can do Scenarios – audience participation required! The plan
Software aimed to enhance presentation of geography and statistics. Geo-wise Increasingly used in presenting key PH information / indicators. UK and Internationally What is an Interactive Atlas?
HPA - Immunisation, EMPHO - Teenage Pregnancy, The National Child and Maternal Health Observatory (CHIMAT) – child and maternal health survey PHO-Community Health Profiles, SEPHO - National Hospital Episode Statistics, National Obesity Observatory – Obesity prevalence-Diabetes How HAS it BEEN implemented
Health care professionals Commissioners Health Service Managers Members of the public Have any of you used the cancer e-atlas before? What for? Who’s it for?
Analysing local service provision in relation to targets Make decisions on where resources need to be directed Comparisons locally/nationally/over time/different indicators Display/present complex data which is clear/easy to understand What can it be used for?
CURRENT • Local Authority • MORTALITY • INCIDENCE • Cancer Network • All of the above plus RELATIVESURVIVAL • 1 YEAR, 3 YEAR, 5 YEAR • ALL available for MALES, FEMALES and PERSONS • GORs • Highlights Spearheads • Double map to enable comparison of indicators What’s Available? http://www.ncin.org.uk/analysis/eatlas.shtml
All malignant neoplasms – various age groups Bladder Brain Cervical Breast Colorectal Kidney Leukaemia Lung Melanoma Non-Hodgkins Oesophageal Ovarian Pancreatic Stomach Uterine What’s Available?
Main difference – PCT and Cancer Network maps with SHA comparative areas • More up to date. Incidence -94/96 to 04/06; Mortality to 06/07; Survival follow up to 2007. • Better looking • Additional features • Some survival stats at PCT level – the big four • Time series animation • Modify the layout – better exporting of apps What’s NEW?
Cancer Network Map PCT Map HAVE A GO!