Download
1 / 6
60 likes | 219 Vues
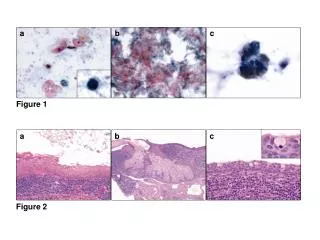
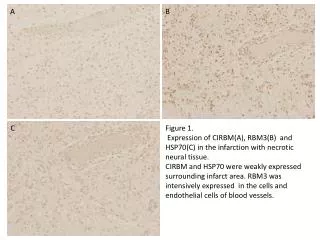
A. B. C. Figure 1 . Expression of CIRBM(A), RBM3(B) and HSP70(C) in the infarction with necrotic neural tissue. CIRBM and HSP70 were weakly expressed surrounding infarct area. RBM3 was intensively expressed in the cells and endothelial cells of blood vessels. A. B. C.

E N D
A B C Figure 1. Expression of CIRBM(A), RBM3(B) and HSP70(C) in the infarction with necrotic neural tissue. CIRBM and HSP70 were weakly expressed surrounding infarct area. RBM3 was intensively expressed in the cells and endothelial cells of blood vessels.
A B C Figure 2. Expression of HIF1, VEGF and eNOs in the infarction with necrotic neural tissue. Although expression of HIF1 (A) was feeble, that of VEGF (B) was weak and that of eNOs (C) was clearly in macrophages. Expression of eNOs was stronger than that of infarction with bleeding and expressed in the endothelial cells of blood vessels.
A B C Figure 3. Expression of CIRBM, RBM3 and HSP70 in the infarction with remarkable macrophages and tissue loss in the cerebral cortex. CIRBM (A) and HSP70 (C) were weakly expressed in some macrophages and RBM3 (B) was intensively expressed in the cells and endothelial cells of blood vessels.
A B C Figure 4. Expression of HIF1, VEGF and eNOs in the infarction with remarkable macrophages and tissue loss in the cerebral cortex. Although expression of HIF1 (A) was feeble, that of VEGF (B) was weak and that of eNOs (C) was clearly in macrophages. Expression of eNOs was stronger than that of infarction with bleeding and expressed in the endothelial cells.
A B C D E F G Figure 5. Expression of Ngb(A), Wnt(B), AIF1(C), cFos(D), p53(E), SIRT1(F), and CCC9(G) in the infarction with remarkable macrophages and tissue loss in the cerebral cortex. Expressions of Ngb, Wnt ,AIF and cFos were weakly detected, p53 and CCC9 were not observed, and SIRT1 was moderately detected .
Table 1. Characteristics of the antibodies used in this study