Chapter 2 Scatter plots, Correlation, Linear Regression, Inferences for Regression
140 likes | 387 Vues
Chapter 2 Scatter plots, Correlation, Linear Regression, Inferences for Regression. By: Tasha Carr, Lyndsay Gentile, Darya Rosikhina, Stacey Zarko. Scatter plots. Shows the relationship between two quantitative variables measured on the same individuals Look at:

Chapter 2 Scatter plots, Correlation, Linear Regression, Inferences for Regression
E N D
Presentation Transcript
Chapter 2Scatter plots, Correlation, Linear Regression, Inferences for Regression By: Tasha Carr, Lyndsay Gentile, Darya Rosikhina, Stacey Zarko
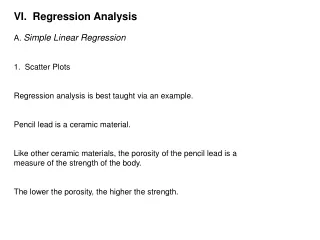
Scatter plots • Shows the relationship between two quantitative variables measured on the same individuals • Look at: • Direction- positive, negative, none • Form-straight, linear, curved • Strength- little scatter means little association • great scatter means great association • Outliers- make sure there are no major outliers
correlation • Measures the direction and strength of the linear relationship • Usually written as r • r is the correlation coefficient • Not resistant
correlation • Rules: • It does not change if you switch x and y • Both variables must be quantative • Does not change when we change units of measurement • Positive r shows positive association, negative r shows negative association • Always between -1 and 1 • Values near 0 show weak linear relationship • Strength of relationship increases as r moves toward -1 and 1 (means points lie in straight line) • Not resistant, so outliers can change the value • Bad measure for curves
Least-Squares Regression • Makes the sum of the squares of the vertical distances of the data points from the line as small as possible (not resistant) • Ŷ = b0 + b1 x • b1 x = slope • b1 = (sy / sx )(r) • Amount by which y changes when x increases by one unit • b0 = y-intercept • Value of y when x=0 • b0 = (y-bar) - b1 x • Extrapolation- making predictions outside of the given data ; inaccurate
Least-Squares Regression • A Regression Line is a straight line that describes how a response variable as an explanatory variable x changes • Based on correlation • Used to predict the value of y for a given value of x • R2 = Coefficient of Determination • In the model, R2 of the variability in the y-variable is accounted for by variation in the x-variable.
Residuals • Minimized by the LSRL • Difference between actual and predicted data • Observed – Expected • Actual – Guess • e = Y – Ŷ • Positive residuals – underestimates • Negative residuals – overestimates
Residual Plot • A scatter plot of the regression residuals against the explanatory variable or predicted values • Shows if linear model is appropriate • If there is no apparent shape or pattern and residuals are randomly scattered, linear model is a good fit • If there is a curve or horn shape, or big change in scatter, linear model is not a good fit
Lurking Variables • Variable that has an important effect on the relationship among the variables in a study but is not included among the variables studied • Make a correlation or regression misleading • An outlier- point that lies outside the overall pattern of the other observations • Influential point- removing it would change the outcome (outliers in the x- direction)
Causation • An association between an explanatory and response variable does not show a causation, or cause and effect relationship, even if there is a high correlation • Correlation based on averages is higher than data from individuals
Inference for Regression • Used to test if there is an association between two quantitative variables based on the population • To test for an association we check β1 • If no association exists this should be zero
Inference for Regression • Hypothesis: • H0 : β1 = 0. There is no association • HA : β1 ≠ 0. There is an association. • Conditions: • Straight Enough: Check for no curves in scatter plot. • Independence: Data is assumed independent. • Equal Variance: Check residual plot for changes in spread • Nearly Normal: Create histogram or Normal Probability plot of the residuals. • All conditions have been met to use a student’s t-model for a test on the slope of a regression model.
Inference for Regression • Mechanics • Df = n – 2 • t= (b1 – 0)/(SE(b1 ) • P-value = 2P(tn-2 > or < t) b0 b1 P-value • t= (b1 – 0)/(SE(b1 ) SE (b1 )
Inference for Regression • Conclusion • If the p-value is less than alpha, reject the null hypothesis • If we reject H0, there is evidence of an association • If the p-value is greater than alpha, we fail to reject the null hypothesis • If we fail to reject the H0 , there is not enough evidence of an association