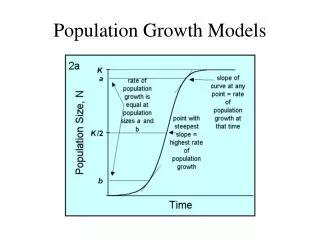

Age-structured population assessment models
E N D
Presentation Transcript
Intro • ASA (age-structured assessment) models permit reconstruction of the population dynamics • Provide estimates of mortality rates and population abundance • ASA is the primary method used for providing management advice
Advantages • Can be applied without knowledge of: • Fishing effort • Catchability • Gear selectivity • Do not rely on FD CPUE as an IOA (a common problem with earlier assessment models) • Hyper depletion patterns bias • Availability of “aged catch” data, starting in the 1960’s has lead to widespread use. • Rise of “microcomputing” Moore’s Law
Historical roots • Derzhavin (1922) first to apply data describing age structure of a population to catch statistics in order to calculate the contribution of each cohort to each years’ total catch • Derived from Baranov (1918) • Catch (in numbers) is a function of initial population abundance, fishing, and natural mortality M.
Question: • Consider a population of 1,200 age-0 fish. • 30% lost to natural mortality, 40% lost to fishing mortality. Fishing occurs on ages 2 to 6. • Create a table with columns: • Year, Abundance (F = 0), Abundance (F = realized F), Catch
Historical roots • In an age-structured population, the population size of a cohort as it enters the exploitable phase can be approximated by summing the catches removed from the cohort during the years it contributes to the fishery. • Summing catch provides an estimate of the population must have been alive in order to generated the observed catches. • Use mean age composition of the catch data from many years.
Historical roots • Derzhavin (1922) analysis provides the minimum estimate of the total population • Ignores M • Use of mean estimate does not allow understanding of annual trends • Provides a minimum estimate of total population size
Historical roots • Beverton (1954) and Beverton and Holt (1957) proposed age-structured models that emphasized the estimation of M • Formulations allow population reconstruction. • Terminal F problem – reconstructions are very sensitive to the ‘terminal’ F value. • Unfortunately, this is the exact information needed by fisheries managers…. • Pope’s (1972) resolution – change exponential decay with a step function – computationally much simpler.
Seperability assumption • Standard feature of ASA • Fishing mortality is the product of age- and year- specific coefficient. • Therefore, any one year fishing mortality can be described by two factors: • F (full) • Differential effect of the annual exploitation pattern on various age groups of the stock • “separability of fishing mortality into year and age components”
ASA data sources • Catch-at-age • Observed from catch-at-length • Use length-at-age conversion • Total catch • Determine age composition of catch • Effort data • Stratified by gear type • Integrated analysis… • Incorporate many, many data sources • “tuned”