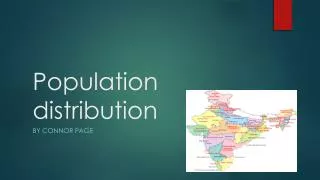
Spatial Distribution of Philippine Population
210 likes | 550 Vues
Spatial Distribution of Philippine Population. Reported by: Supelana , Angeline Rose P. III-6 BEED Prof. Gerry Areta Course Instructor. Population.

Spatial Distribution of Philippine Population
E N D
Presentation Transcript
Spatial Distribution of Philippine Population Reported by: Supelana, Angeline Rose P. III-6 BEED Prof. Gerry Areta Course Instructor
Population • Population is about people, and the dwellings, locations and environments that people live in. Population can be defined in many ways, for example by age, ethnicity, type of housing, birthplace or location. • All of the people inhabiting a specified area or the total number of such people. • The total number of inhabitants constituting a particular race, class, or group in a specified area.
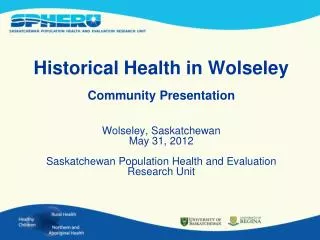
Population Structure • The structure of a population describes the relative numbers of people with similar characteristics within a population, for example, age groups, sex, ethnicity. The structure of a population shows how the subgroups within it affect its composition and characteristics. For example, it shows the percentages making up the different age groups of the population. • Population structure changes over time as people age, but also because of births, deaths and migration. Changes to social, environmental and economic conditions can also influence population structure. For example, changes in migration reflect a number of these factors and have different effects on different age groups. • The interrelationship between population, society, economics and the environment defines a population’s future size and make-up.
Population Size • Population size can refer to the total number of people living within a defined area, or it can refer to a group of people from a defined area who have similar characteristics (eg children aged 0 to 4 years, people of Asian ethnicities, people who live in two-bedroom houses, people who live in Mangere or in the Southland region).
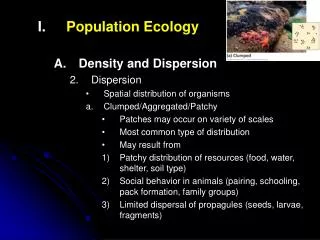
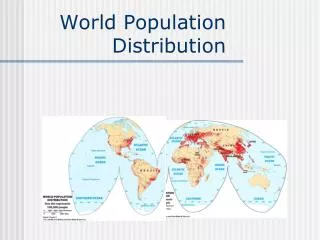
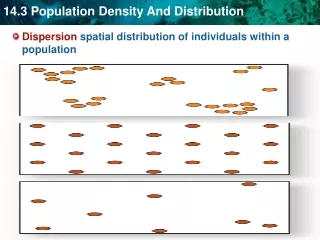
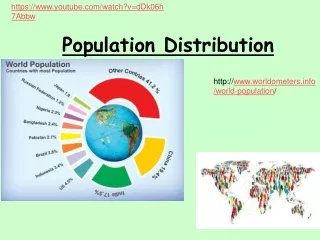
Population Distribution • Distribution of a population within a defined area can be an important factor to consider in planning and analysis work. For example, clusters of families in only some suburbs of a city could influence planning for future school placement.
Measuring Population • Population can be measured in three ways: actual counts of people, estimates of changes in actual counts due to population growth from births, deaths and migration, and projections of changes to future numbers of inhabitants.
CIA World FactbookDemographic Statistics Population • 97,976,603 (July 2010 est.) (July 2010 est.) • country comparison to the world: 11 Age structure • 0-14 years: 35.2% (male 17,606,352/female 16,911,376) • 15-64 years: 60.6% (male 29,679,327/female 29,737,919) • 65 years and over: 4.1% (male 1,744,248/female 2,297,381) (2010 est.) Population growth rate • 1.957% (2010 est.)
Birth rate • 26.01 births/1,000 population (2010 est.) • country comparison to the world: 63 Death rate • 5.1 deaths/1,000 population (July 2010 est.) • country comparison to the world: 184 Net migration rate • -1.34 migrant(s)/1,000 population (2010 est.) • country comparison to the world: 127 Urbanization • urban population: 65% of total population (2008) • rate of urbanization: 3% annual rate of change (2005-10 est.)
Sex ratio • at birth: 1.05 male(s)/female • under 15 years: 1.04 male(s)/female • 15-64 years: 1 male(s)/female • 65 years and over: 0.76 male(s)/female • total population: 1 male(s)/female (2010 est.) Infant mortality rate • total: 20.56 deaths/1,000 live births • country comparison to the world: 102 • male: 23.17 deaths/1,000 live births • female: 17.83 deaths/1,000 live births (2010 est.)
Life expectancy at birth • total population: 71.09 years • country comparison to the world: 133 • male: 68.17 years • female: 74.15 years (2010 est.) Total fertility rate • 3.23 children born/woman (2010 est.) Ethnic groups • Tagalog 28.1%, Cebuano 13.1%, Ilocano 9%, Bisaya/Binisaya 7.6%, Hiligaynon Ilonggo 7.5%, Bikol 6%, Waray 3.4%, Kapampangan 3%, other 25.3% (2000 census)
Religions • Roman Catholic 80.9%, Muslim 5%, Evangelical 2.8%, Iglesiani Cristo 2.3%, Aglipayan 2%, other Christian 4.5%, other 1.8%, unspecified 0.6%, none 0.1% (2000 census) Languages • Filipino (national language, official; based on Tagalog) and English (official); Other languages include Cebuano, Ilocano, Hiligaynon, Bicol, Waray, Pampango, and Pangasinense Literacy • definition: age 15 and over can read and write • total population: 92.6% • male: 92.5% • female: 92.7% (2000 census)
School life expectancy (primary to tertiary education) • total: 12 years • male: 11 years • female: 12 years (2006) The following are the twenty largest ethnic groups in the Philippines: • Cebuano (20,160,000; largest) • Tagalog (13,928,000; second largest) • Ilocano (9,527,000; 3rdlargest) • Hiligaynon (8,068,000; 4thlargest) • Central Bicolano (3,504,000; 5th largest) • Waray (3,426,000; 6thlargest)
Kapampangan (2,667,000; 7th largest) • AlbayBicolano (2,155,000; 8th largest) • Pangasinan (1,637,000; 9th largest) • Malay (1,287,000; 10thlargest) • Maranao (1,091,000; 11thlargest) • Maguindanao (1,077,000; 12thlargest) • Tausug (1,020,000; 13thlargest) • Min Nan Chinese (922,000; 14thlargest) • Masbateño (764,000; 15thlargest) • Capiznon (724,000; 16thlargest) • Ibanag (703,000; 17thlargest) • Aklanon (555,000; 18thlargest) • Suriganon (485,000; 19thlargest) • Kinaray-A (485,000; 20thlargest)
Table 1. Summary of Projected Population by Sex and by Single-Calendar Year Interval, Philippines: 2000 - 2010 ========================================================================================================================= Sex | 2000 | 2001 | 2002 | 2003 | 2004 | 2005 | 2006 | 2007 | 2008 | 2009 | 2010 ------------------------------------------------------------------------------------------------------------------------------------------------ Low Assumption Male 38,748,500 39,554,900 40,365,700 41,180,400 41,999,700 42,823,200 43,651,100 44,482,800 45,319,100 46,159,600 47,004,600 Female 38,198,000 39,014,700 39,834,300 40,657,200 41,483,300 42,312,000 43,143,900 43,978,900 44,816,900 45,657,900 46,502,000 Both Sexes 76,946,500 78,569,600 80,200,000 81,837,600 83,483,000 85,135,200 86,795,000 88,461,700 90,136,000 91,817,500 93,506,600 Medium Assumption Male 38,748,500 39,554,100 40,373,300 41,200,600 42,037,200 42,887,300 43,742,100 44,608,300 45,483,100 46,368,900 47,263,600 Female 38,198,000 39,014,000 39,843,900 40,677,100 41,521,500 42,373,700 43,230,400 44,098,000 44,974,100 45,857,700 46,749,600 Both Sexes 76,946,500 78,568,100 80,217,200 81,877,700 83,558,700 85,261,000 86,972,500 88,706,300 90,457,200 92,226,600 94,013,200 High Assumption Male 38,748,500 39,559,200 40,383,000 41,219,300 42,068,700 42,931,100 43,806,400 44,694,200 45,595,100 46,508,700 47,435,600 Female 38,198,000 39,018,900 39,851,000 40,694,700 41,549,600 42,415,400 43,292,600 44,181,100 45,080,800 45,991,700 46,914,000 Both Sexes 76,946,500 78,578,100 80,234,000 81,914,000 83,618,300 85,346,500 87,099,000 88,875,300 90,675,900 92,500,400 94,349,600 ------------------------------------------------------------------------------------------------------------------------------------------------ Source: National Statistics Office 2000 Census-based Population Projection in collaboration with the Inter-Agency Working Group on Population Projections Page last updated:December 8, 2006
MGA SALIK NA MAY KINALAMAN SA PAGLAKI NG POPULASYON • Birth Rate Bilangngipinapanganak ---------------------------------- x 1000 Kabuuangpopulasyon • Mortality Rate Bilangngnamamatay --------------------------------- x 1000 Kabuuangpopulasyon
DENSITI O KAPAL NG POPULASYON Bilangngtao = --------------------------- Kabuuangsukatnglugar 88 574 614 = ---------------------- 3oo 000 km kw = 295.25
Table 4. Projected Populations by Five-Year Age Group and Sex, by Region and Province, and by Five-Calendar Years: 2000-2040 • (Medium Series) • ================================================== • Region/Province/Sex 2000 | 2005 | 2010 | 2015 | • --------------------------------------------------------------------------------------- • Philippines • Both Sexes • 0-4 9,902,800 10,422,900 10,984,800 11,386,600 • 5-9 9,683,000 9,830,900 10,370,300 10,950,900 • 10-14 8,960,400 9,647,600 9,801,500 10,343,600 • 15-19 8,010,600 8,915,700 9,603,300 9,757,800 • 20-24 7,115,000 7,952,200 8,857,500 9,544,900 • 25-29 6,120,400 7,051,800 7,892,000 8,795,500 • 30-34 5,591,700 6,067,400 7,001,500 7,842,700 • 35-39 4,898,700 5,527,500 6,008,400 6,942,200 • 40-44 4,177,900 4,811,000 5,442,300 5,924,800 • 45-49 3,342,500 4,071,500 4,702,100 5,330,100 • 50-54 2,638,400 3,214,600 3,931,600 4,554,700 • 55-59 1,917,300 2,490,300 3,050,800 3,747,900 • 60-64 1,640,400 1,765,800 2,307,800 2,843,700 • 65-69 1,147,600 1,436,800 1,559,300 2,055,900 • 70-74 801,900 937,000 1,189,400 1,305,700 • 75-79 505,800 589,000 700,500 904,200 • 80+ 492,100 529,000 610,100 734,100 • All Ages 76,946,500 85,261,000 94,013,200 102,965,300
POPULASYON AYON SA LAKAS PAGGAWA Philippines 2009 • Population 15 years and over = (in '000)59,23757,848 • Labor Force Participation Rate= (%) 64.063.6 • Employment Rate= (%)92.592.6 • Unemployment Rate= (%)7.57.4 • Underemployment Rate= (%)19.119.3 Source: NSO, Annual Employment and Labor Estimates,2009
MgaSuliraninsaPagkakaroonngMalakingPopulasyon • Tumitindingkahirapan • Tumataasnakrimen • Paglaganapngsakit • Kawalanngtirahan • Pang-aabusosakapalaigiran • Kawalanngtrabaho • Kulangsapagkain • Kakulangansaedukasyon • Problemasakapaligiran
Thank You!!! -xoxo-