Spatial patterns of S.dorsalis distribution
120 likes | 157 Vues
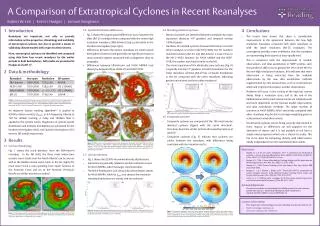
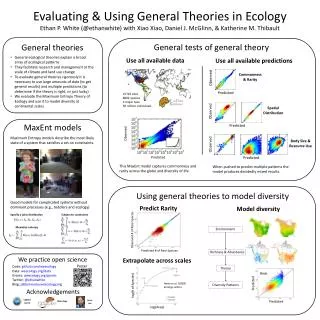
Investigating spatial patterns of S. dorsalis using Taylor’s power law and Iwao’s patchiness regression in a 0.5-acre pepper field. Results suggest aggregation of thrips with implications for pest management strategies.

Spatial patterns of S.dorsalis distribution
E N D
Presentation Transcript
Spatial patterns of S.dorsalis distribution • Materials and Methods: • 0.5 acre pepper field. • Divided into 60 equal sections. • 10 terminals and 10 fruits were collected from each section. • Each sample was placed in a plastic bag and transported to the laboratory. • Thrips were separated by washing leaves with 70% ethanol. • Numbers were recorded using a binocular microscope.
SPATIAL DISTRIBUTION OF S.DORSALIS IN PEPPER FIELD • Spatial distribution patterns were compared by using: • Taylor’s power law • Iwao’s patchiness regression • Index of dispersion • Mean crowding • Green,s Index • Lloyd’s Patchiness Index
Spatial distribution of S. dorsalis Taylor’s power law: log s2 = log a + b log x Linear regression procedure by Neter & Wasserman, 1974 Iwao’s patchiness regression:x* = alpha + beta x Alpha is a sampling factor depending on the size of the sampling unit Beta is an index of the aggregation in the population b/beta value > 1 = aggregated distribution b/beta value < 1 = regular distribution B/beta value not significantly > 1= random distribution
Distribution of S. dorsalis adults in a scotch bonnet pepper fieldbased on terminal leaf samples Taylor’s Power Law Iwao’s patchiness regression
Distribution of S. dorsalis adults in a scotch bonnet pepper fieldbased on terminal leaf samples
Distribution of S. dorsalis larvae in a scotch bonnet pepper fieldbased on terminal leaf samples Taylor’s Power Law Iwao’s patchiness regression
Distribution of S. dorsalis larvae in a scotch bonnet pepper field based on terminal leaf samples
Distribution of S. dorsalis adults in a scotch bonnet pepper fieldbased on fruit samples Taylor’s Power Law Iwao’s patchiness regression
Distribution of S. dorsalis adults in a scotch bonnet pepper fieldbased on fruit samples
Distribution of S. dorsalis larvae in a scotch bonnet pepper fieldbased on fruit samples Taylor’s Power Law Iwao’s patchiness regression
Distribution of S. dorsalis larvae in a scotch bonnet pepper fieldbased on fruit samples
Summary • Both Taylor’s power law and Iwao’s Regression best describe the distribution of S. dorsalis in pepper field. The aggregated pattern of S. dorsalis in a smaller plots was also reflected in Index of dispersion, mean crowding.