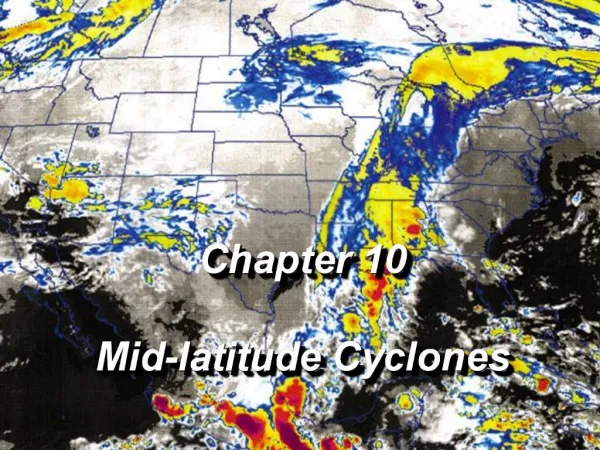
Mid-latitude Cyclones and Weather Forecasting
690 likes | 1k Vues
Mid-latitude Cyclones and Weather Forecasting. AT351 Lab 9 March 26, 2008. Mid-latitude ( Extratropical ) Cyclone. A cyclone (area of low pressure) in the middle (35°-70°) latitudes Important for global heat transport

Mid-latitude Cyclones and Weather Forecasting
E N D
Presentation Transcript
Mid-latitude Cyclones and Weather Forecasting AT351 Lab 9 March 26, 2008
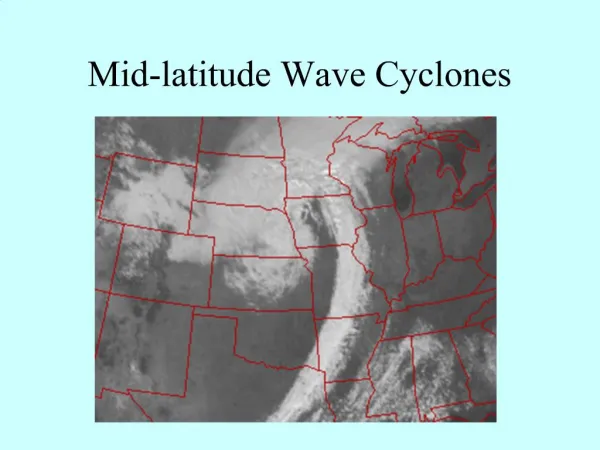
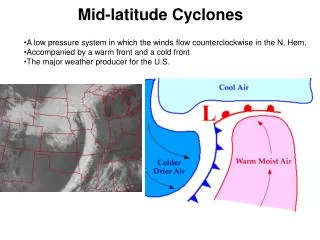
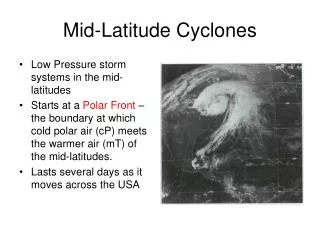
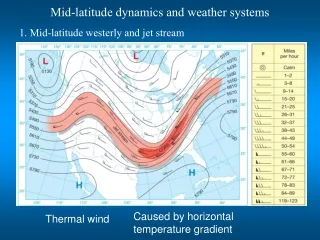
Mid-latitude (Extratropical) Cyclone • A cyclone (area of low pressure) in the middle (35°-70°) latitudes • Important for global heat transport • Help to redistribute energy between the tropics (equator) and the poles • Often associated with significant weather events • Described by the Polar Front Theory • Form on boundaries between warm and cold air • Polar front is the boundary between polar cell and Ferrel cell • Cold Polar air meeting warm tropical air
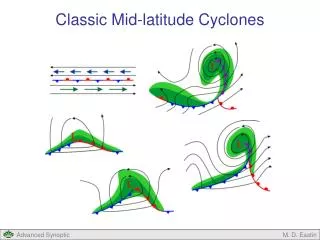
Features of a Mid-latitude Cyclone • Deep low pressure area with attached cold and warm fronts • Often an occlusion forms, the triple point lending to the formation of severe weather • Precipitation associated with the cold and warm fronts organizes in typical “comma cloud” structure
Stages in Wave Cyclone Development Polar Front -->
Polar Front Theory • Initially, there is a stationary front that acts as the boundary separating cold, continental polar air from warm, maritime tropical air • Winds blow parallel to this front on either side • Flow around the highs
Cyclogenesis Central Pressure • A wave forms on the front due to a shortwave disturbance • Frontal Wave • Incipient Cyclone • The front develops a "kink" where the wave is developing • Precipitation will begin to develop along the front • Overrunning and lifting
Strengthening • The cyclonic circulation around the low becomes more defined • The central pressure intensifies • The cold front and warm front have more organized motion • Cyclone usually pushed east or northeast by the winds aloft
Mature Cyclone • The cold front catches up with the warm front and an occlusion forms • Where does the energy to do all of this come from? • The cyclone is at its strongest at this point • Severe weather often develops near the “triple point” • Note: Precipitation in 3 locations
Dissipation • The occlusion grows with time • Eventually, the occlusion is so great that the supply of warm, moist air into the low is cut off • Cold air on both sides • When this happens, the system starts to dissipate
Strengthening • A low pressure area’s strength is defined by how low the pressure is • Hence, all a low needs to strengthen is for its pressure to drop in the center • How might that happen?
Strengthening Low • We know that for the pressure to drop, air must leave the column • It isn’t leaving at the surface, because the wind is spiraling inward • Therefore, it must leave at the upper levels • Rising motion will cause this
What is this showing? What do the dashed lines represent?
Long Waves vs Short Waves • Uneven heating causes troughs and ridges to form around the globe • An almost constant ring of trough/ridge patterns exist, called longwaves • The Polar Vortex • Waves usually move west-east, but can sometimes appear to move westward • Called retrograde motion • Within these longwaves, disturbances exist called shortwaves • Shortwaves deepen in longwave troughs • Shortwaves weaken in longwave ridges • Shortwaves move faster (generally)
Interaction with Upper Levels • Previous model for cyclone development only includes surface characteristics – but what happens higher up can determine what happens below • Remember this picture? • Turns out that divergence aloft can help to remove mass from a column, hence lowering the surface pressure even more
Interaction with Upper Levels • Downstream of an upper level trough, the air tends to diverge • If a surface low is located slightly downstream of an upper level trough, the divergence will be located above the low and help to intensify it
Mid-latitude Cyclones : The Upper Level • A 500 mb trough moves into place directly above a surface stationary front • If a shortwave trough moves into the main flow, the flow pattern is disturbed • As the 500 mb trough deepens, the associated upper level divergence strengthens, helping to intensify the surface low • Stronger winds aloft force the upper level trough to move eastward faster, and eventually it becomes located above the surface low • When the surface and upper level low are “stacked”, convergence at both levels starts to “fill” the low pressure area, weakening the cyclone
Another Example – Jet Streaks • A jet streak is an area within a jet stream that has the highest wind speeds • Typically jet streaks are thought of as made up of four quadrants – separated by left and right, entrance and exit • The right entrance region and the left exit region both contain divergence (aloft) and so they promote the development of surface low pressure systems • Due to shifts in the Coriolis Force brought about by acceleration of the wind
Weather Forecasting - Qualitative • Most information for a qualitative forecast can be seen on a simple weather map • If you see a low pressure area that has been moving eastward towards Colorado, what type of weather might you expect? • If a cold front is moving southward through Wyoming, what would you expect the temperature to do? • If it’s going to be cloudy tomorrow, will it be warmer or colder than it was today? • Often the best forecast is persistence: if it’s warm and sunny today, and it was warm and sunny yesterday, the odds are pretty good that it will be warm and sunny tomorrow (unless you know something else)
Weather Forecasting - Quantitative • In order to predict specific quantities in a forecast (temperature, humidity, rainfall) we rely on computer models • Numerical weather prediction (NWP) uses a system of equations that describes the behavior of the atmosphere • NWP model uses the current state of the atmosphere as its initial condition and steps through a small time step, recalculating every number for each step until the forecast time is reached
Initialization • A computer model has a set of equations in it that dictate what will happen based on what we already know • Takes the actual initial conditions and applies the equations to create a picture of the weather 5 minutes from now • Calls that prediction the “new data” and runs another 5 minutes • Repeats until you get the desired forecast (12 hours, 24 hours, etc)
MOS • The output from a model can be shown in the form of Model Output Statistics (MOS) • MOS is a summary of the predicted condition of the atmosphere at each forecast time • MOS is often called “model guidance”, because forecasters will use the generated numbers as a guide to make their forecast • MOS isn’t perfect though, and forecasting takes some intuition
What models produce output for use in MOS? See UCAR website. • The Eta Model: runs forward 84 hours • The GFS (Global Forecasting System) model runs forward for 10 days. • Combines the old “Aviation” and “Medium-Range Forecast” (MRF) models • The NGM (Nested Grid Model): an older model that is largely replaced by the Eta although it has a high quality climatological dataset for use in MOS.
The premise behind MOS • The (preceding) models produce output describing the weather over No. America and vicinity at grid points or in “wave space”. • Conditions for this time of year at a specific city may have occurred similarly in the historic past (i.e., old climate data are used). • Forecasts of current conditions can be made for a city using the current model output and based on the historic weather outcomes.
Downfalls of MOS • There isn’t just one model that is used for NWP • Multiple models are used that have differences in resolution and in the equations used and assumptions made • The models never agree on everything • A good forecaster will look at multiple model predictions and have a feel for which model performs the best under certain circumstances
So why aren’t forecasts always right? • Observations aren’t good enough! • A model is only as good as its initial conditions • Even having an observation for every square meter of the planet would leave out smaller details…and we don’t have even close to that many observations • Computers aren’t fast enough! • In order to truly create a perfect forecast, one would have to use the exact equations on a really, really small spatial scale • In order to create a model that will create a 12 hour forecast in less than 12 hours, we must approximate certain parts of equations and run the model on a grid with spacing of multiple kilometers • ~1.2 million grid points x thousands of calculations > 1 Billion calculations per time step • More than 1 Quadrillion calculations per time step at 1 meter resolution (1012) • More than 4 Quadrillion calculations to simulate 12 hours • Forces us to make approximations to the equations that govern the atmosphere • Little bit of error added at each time step • Chaos reigns supreme! • Ever heard of the butterfly effect? It’s more than just a movie
Chaos Theory • Also known as the “Butterfly Effect”, coined by Dr. Edward Lorenz in the 60’s (he’s still teaching at MIT) • Basically says that even the most insignificant change to initial conditions will magnify into drastic changes • The smallest disturbance will eventually grow into a large difference – this limits the range of forecasts to just a few days • Even if the initial conditions and computing power were perfect, chaos theory would limit us to a reasonable range of about 2 weeks • Computers cannot possibly predict the movement of a butterfly, or how hard you step on the gas pedal
So How far have we come? • 100 years ago we just looked to the west. • The first attempt at numerical weather prediction by Lewis Fry Richardson was done by hand. • On a WWI battlefield as part of an ambulance unit in Northern France • Just wanted to predict the pressure change over the next six hours • Calculation took him six weeks! • And he was off by over 140 mb…
How far have we come? • In 1937, the US started using weather balloons. • It wasn’t until WWII that the existence of a jet stream was confirmed. • In 1948, ENIAC was put together by John von Neumann in a 30 by 50 room. • In April 1950, the first 24-hr forecast was attempted. • Took more than 24 hours due to breakdowns • 8 years later, forecasts began to show signs of skill. • As it stands today, we can have a great deal of faith in a weather forecast out to about 3 days. • Just 30 years ago, we could only do 2 days • Beyond that, the accuracy drops dramatically • If you see a 15 day forecast…don’t believe it
Improvements • As computers improve and we can run better models, we may be able to extend the range to 4 or 5 days in our lifetimes • Better numerical techniques • Fewer approximations • Better measurements • Better understanding of interactions with other systems • However, because of chaos, and that sensitive dependence on initial conditions it is unlikely that we will ever go much farther than that
Station Name – Artesia, NM Date and Time the Model was run
Decoding MOS – Max and Min Temperature KMIA AVN MOS GUIDANCE 9/04/2003 0600 UTC DT /SEPT 4 /SEPT 5 /SEPT 6 / HR 12 15 18 21 00 03 06 09 12 15 18 21 00 03 06 09 12 15 18 00 06 X/N 89 77 89 76 91 TMP 79 85 86 84 81 80 79 79 80 84 85 83 80 79 77 77 79 85 88 82 78 DPT 77 76 75 75 75 76 76 76 77 76 75 74 74 75 75 75 76 75 74 74 74 CLD BK BK BK OV OV OV OV OV OV OV OV OV OV OV OV OV OV OV OV OV BK WDR 00 19 17 17 14 13 16 17 20 23 22 24 24 23 24 21 22 25 25 26 24 WSP 00 01 04 03 01 01 02 05 03 09 09 08 04 04 04 06 06 11 11 06 05 P06 20 44 25 20 36 55 46 44 35 30 15 P12 45 30 66 68 54 Q06 0 2 0 0 2 4 4 2 4 0 0 Q12 1 1 4 5 4 T06 33/ 0 64/ 0 21/ 0 19/ 0 42/ 0 80/ 0 37/ 0 37/ 0 39/ 0 22/ 0 T12 66/ 0 42/ 0 93/ 0 58/ 0 66/ 0 CIG 7 7 7 6 6 7 7 7 7 6 4 5 4 4 4 5 6 5 5 7 7 VIS 7 7 7 7 7 7 7 7 7 7 7 7 7 7 7 7 7 7 7 7 7 OBV N N N N N N N N N N N N N N N N N N N N N
Decoding MOS – 3 hourly temperature forecasts KMIA AVN MOS GUIDANCE 9/04/2003 0600 UTC DT /SEPT 4 /SEPT 5 /SEPT 6 / HR 12 15 18 21 00 03 06 09 12 15 18 21 00 03 06 09 12 15 18 00 06 X/N 89 77 89 76 91 TMP 79 85 86 84 81 80 79 79 80 84 85 83 80 79 77 77 79 85 88 82 78 DPT 77 76 75 75 75 76 76 76 77 76 75 74 74 75 75 75 76 75 74 74 74 CLD BK BK BK OV OV OV OV OV OV OV OV OV OV OV OV OV OV OV OV OV BK WDR 00 19 17 17 14 13 16 17 20 23 22 24 24 23 24 21 22 25 25 26 24 WSP 00 01 04 03 01 01 02 05 03 09 09 08 04 04 04 06 06 11 11 06 05 P06 20 44 25 20 36 55 46 44 35 30 15 P12 45 30 66 68 54 Q06 0 2 0 0 2 4 4 2 4 0 0 Q12 1 1 4 5 4 T06 33/ 0 64/ 0 21/ 0 19/ 0 42/ 0 80/ 0 37/ 0 37/ 0 39/ 0 22/ 0 T12 66/ 0 42/ 0 93/ 0 58/ 0 66/ 0 CIG 7 7 7 6 6 7 7 7 7 6 4 5 4 4 4 5 6 5 5 7 7 VIS 7 7 7 7 7 7 7 7 7 7 7 7 7 7 7 7 7 7 7 7 7 OBV N N N N N N N N N N N N N N N N N N N N N
Decoding MOS – Cloud Cover KMIA AVN MOS GUIDANCE 9/04/2003 0600 UTC DT /SEPT 4 /SEPT 5 /SEPT 6 / HR 12 15 18 21 00 03 06 09 12 15 18 21 00 03 06 09 12 15 18 00 06 X/N 89 77 89 76 91 TMP 79 85 86 84 81 80 79 79 80 84 85 83 80 79 77 77 79 85 88 82 78 DPT 77 76 75 75 75 76 76 76 77 76 75 74 74 75 75 75 76 75 74 74 74 CLD BK BK BK OV OV OV OV OV OV OV OV OV OV OV OV OV OV OV OV OV BK WDR 00 19 17 17 14 13 16 17 20 23 22 24 24 23 24 21 22 25 25 26 24 WSP 00 01 04 03 01 01 02 05 03 09 09 08 04 04 04 06 06 11 11 06 05 P06 20 44 25 20 36 55 46 44 35 30 15 P12 45 30 66 68 54 Q06 0 2 0 0 2 4 4 2 4 0 0 Q12 1 1 4 5 4 T06 33/ 0 64/ 0 21/ 0 19/ 0 42/ 0 80/ 0 37/ 0 37/ 0 39/ 0 22/ 0 T12 66/ 0 42/ 0 93/ 0 58/ 0 66/ 0 CIG 7 7 7 6 6 7 7 7 7 6 4 5 4 4 4 5 6 5 5 7 7 VIS 7 7 7 7 7 7 7 7 7 7 7 7 7 7 7 7 7 7 7 7 7 OBV N N N N N N N N N N N N N N N N N N N N N
Decoding MOS - Cloud Cover • CL = Clear, no clouds • SC = Scattered, between clear and the sky ½ filled with clouds • BK = Broken, between sky ½ filled with clouds and totally cloudy • OV = Overcast, sky filled with clouds
Decoding MOS – Winds KMIA AVN MOS GUIDANCE 9/04/2003 0600 UTC DT /SEPT 4 /SEPT 5 /SEPT 6 / HR 12 15 18 21 00 03 06 09 12 15 18 21 00 03 06 09 12 15 18 00 06 X/N 89 77 89 76 91 TMP 79 85 86 84 81 80 79 79 80 84 85 83 80 79 77 77 79 85 88 82 78 DPT 77 76 75 75 75 76 76 76 77 76 75 74 74 75 75 75 76 75 74 74 74 CLD BK BK BK OV OV OV OV OV OV OV OV OV OV OV OV OV OV OV OV OV BK WDR 00 19 17 17 14 13 16 17 20 23 22 24 24 23 24 21 22 25 25 26 24 WSP 00 01 04 03 01 01 02 05 03 09 09 08 04 04 04 06 06 11 11 06 05 P06 20 44 25 20 36 55 46 44 35 30 15 P12 45 30 66 68 54 Q06 0 2 0 0 2 4 4 2 4 0 0 Q12 1 1 4 5 4 T06 33/ 0 64/ 0 21/ 0 19/ 0 42/ 0 80/ 0 37/ 0 37/ 0 39/ 0 22/ 0 T12 66/ 0 42/ 0 93/ 0 58/ 0 66/ 0 CIG 7 7 7 6 6 7 7 7 7 6 4 5 4 4 4 5 6 5 5 7 7 VIS 7 7 7 7 7 7 7 7 7 7 7 7 7 7 7 7 7 7 7 7 7 OBV N N N N N N N N N N N N N N N N N N N N N
Meteorology Wind Direction 180 = From the South 090 = From the East 270 = From the West 000 = From the North
Decoding MOS – Chance of measurable precipitation KMIA AVN MOS GUIDANCE 9/04/2003 0600 UTC DT /SEPT 4 /SEPT 5 /SEPT 6 / HR 12 15 18 21 00 03 06 09 12 15 18 21 00 03 06 09 12 15 18 00 06 X/N 89 77 89 76 91 TMP 79 85 86 84 81 80 79 79 80 84 85 83 80 79 77 77 79 85 88 82 78 DPT 77 76 75 75 75 76 76 76 77 76 75 74 74 75 75 75 76 75 74 74 74 CLD BK BK BK OV OV OV OV OV OV OV OV OV OV OV OV OV OV OV OV OV BK WDR 00 19 17 17 14 13 16 17 20 23 22 24 24 23 24 21 22 25 25 26 24 WSP 00 01 04 03 01 01 02 05 03 09 09 08 04 04 04 06 06 11 11 06 05 P06 20 44 25 20 36 55 46 44 35 30 15 P12 45 30 66 68 54 Q06 0 2 0 0 2 4 4 2 4 0 0 Q12 1 1 4 5 4 T06 33/ 0 64/ 0 21/ 0 19/ 0 42/ 0 80/ 0 37/ 0 37/ 0 39/ 0 22/ 0 T12 66/ 0 42/ 0 93/ 0 58/ 0 66/ 0 CIG 7 7 7 6 6 7 7 7 7 6 4 5 4 4 4 5 6 5 5 7 7 VIS 7 7 7 7 7 7 7 7 7 7 7 7 7 7 7 7 7 7 7 7 7 OBV N N N N N N N N N N N N N N N N N N N N N
Decoding MOS – Quantitative Precipitation Forecast KMIA AVN MOS GUIDANCE 9/04/2003 0600 UTC DT /SEPT 4 /SEPT 5 /SEPT 6 / HR 12 15 18 21 00 03 06 09 12 15 18 21 00 03 06 09 12 15 18 00 06 X/N 89 77 89 76 91 TMP 79 85 86 84 81 80 79 79 80 84 85 83 80 79 77 77 79 85 88 82 78 DPT 77 76 75 75 75 76 76 76 77 76 75 74 74 75 75 75 76 75 74 74 74 CLD BK BK BK OV OV OV OV OV OV OV OV OV OV OV OV OV OV OV OV OV BK WDR 00 19 17 17 14 13 16 17 20 23 22 24 24 23 24 21 22 25 25 26 24 WSP 00 01 04 03 01 01 02 05 03 09 09 08 04 04 04 06 06 11 11 06 05 P06 20 44 25 20 36 55 46 44 35 30 15 P12 45 30 66 68 54 Q06 0 2 0 0 2 4 4 2 4 0 0 Q12 1 1 4 5 4 T06 33/ 0 64/ 0 21/ 0 19/ 0 42/ 0 80/ 0 37/ 0 37/ 0 39/ 0 22/ 0 T12 66/ 0 42/ 0 93/ 0 58/ 0 66/ 0 CIG 7 7 7 6 6 7 7 7 7 6 4 5 4 4 4 5 6 5 5 7 7 VIS 7 7 7 7 7 7 7 7 7 7 7 7 7 7 7 7 7 7 7 7 7 OBV N N N N N N N N N N N N N N N N N N N N N T06, T12: probability of thunderstorms / severe t-storms over 6, 12h
Decoding MOS – Precip. Amount • 0 = no precipitation • 1 = 0.01 to 0.09 inches • 2 = 0.10 to 0.24 inches • 3 = 0.25 to 0.49 inches • 4 = 0.50 to 0.99 inches • 5 = 1.00 to 1.99 inches • 6 = 2.00 inches or greater
Decoding MOS – Local forecast KMIA AVN MOS GUIDANCE 9/04/2003 0600 UTC DT /SEPT 4 /SEPT 5 /SEPT 6 / HR 12 15 18 21 00 03 06 09 12 15 18 21 00 03 06 09 12 15 18 00 06 X/N 89 77 89 76 91 TMP 79 85 86 84 81 80 79 79 80 84 85 83 80 79 77 77 79 85 88 82 78 DPT 77 76 75 75 75 76 76 76 77 76 75 74 74 75 75 75 76 75 74 74 74 CLD BK BK BK OV OV OV OV OV OV OV OV OV OV OV OV OV OV OV OV OV BK WDR 00 19 17 17 14 13 16 17 20 23 22 24 24 23 24 21 22 25 25 26 24 WSP 00 01 04 03 01 01 02 05 03 09 09 08 04 04 04 06 06 11 11 06 05 P06 20 44 25 20 36 55 46 44 35 30 15 P12 45 30 66 68 54 Q06 0 2 0 0 2 4 4 2 4 0 0 Q12 1 1 4 5 4 High Temperature: 89F Low Temperature: 77F Precipitation Category: Cat-4
Decoding MOS – Zone Forecast KMIA AVN MOS GUIDANCE 9/04/2003 0600 UTC DT /SEPT 4 /SEPT 5 /SEPT 6 / HR 12 15 18 2100 03 06 09 1215 18 21 00 03 06 09 1215 18 00 06 X/N 89 7789 76 91 TMP 79 85 86 8481 80 79 798084 85 83 80 79 77 77 7985 88 82 78 DPT 77 76 75 7575 76 76 767776 75 74 74 75 75 75 7675 74 74 74 CLD BK BK BK OVOV OV OV OV OVOV OV OV OV OV OV OV OVOV OV OV BK WDR 00 19 17 17 14 13 16 17 2023 22 24 24 23 24 21 2225 25 26 24 WSP 00 01 04 03 01 01 02 05 0309 09 08 04 04 04 06 0611 11 06 05 P06 20 44 25 2036 5546 44 35 30 15 P12 45 306668 54 Q06 0 2 0 02 44 2 4 0 0 Q12 1 145 4 T06 33/ 0 64/ 0 21/ 0 19/ 042/ 0 80/ 037/ 0 37/ 0 39/ 0 22/ 0 T12 66/ 0 42/ 093/ 058/ 0 66/ 0 Tonight: Mostly cloudy with scattered showers and thunderstorms. Lows in the mid 70s. Light southeast winds. Chance of rain 30%. Tomorrow: Mostly cloudy with scattered to numerous showers and thunderstorms. Highs near 90. Light southwest winds. Chance of rain 70%. Tomorrow Night: Mostly cloudy with scattered showers and thunderstorms. Lows in the mid 70s. Light southwest winds. Chance of rain 70%.