Using Virtual Cities to Plan Real Cities
320 likes | 486 Vues
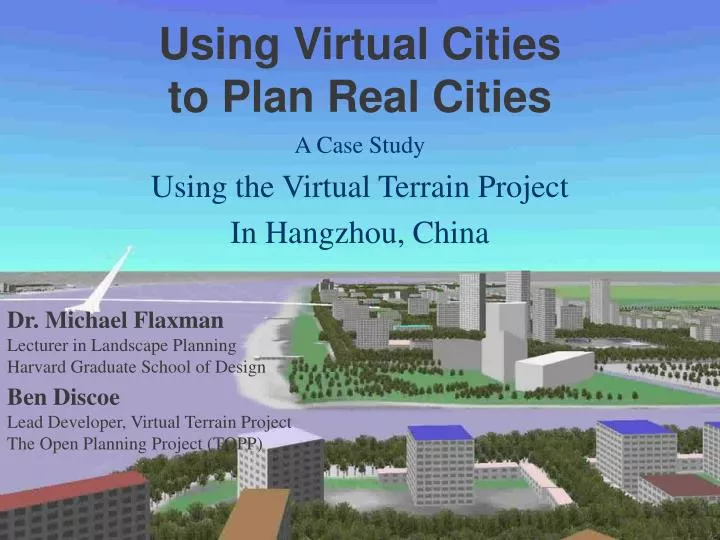
Using Virtual Cities to Plan Real Cities. Dr. Michael Flaxman Lecturer in Landscape Planning Harvard Graduate School of Design. A Case Study Using the Virtual Terrain Project In Hangzhou, China. Ben Discoe Lead Developer, Virtual Terrain Project The Open Planning Project (TOPP).

Using Virtual Cities to Plan Real Cities
E N D
Presentation Transcript
Using Virtual Cities to Plan Real Cities Dr. Michael Flaxman Lecturer in Landscape Planning Harvard Graduate School of Design A Case Study Using the Virtual Terrain Project In Hangzhou, China Ben Discoe Lead Developer, Virtual Terrain Project The Open Planning Project (TOPP)
Cast of Characters 15 Graduate Students in Architecture, Landscape Architecture & Planning One Semester Interdisciplinary Studio (double course): Faculty: Carl Steinitz (Architecture & Landscape Architecture) Mike Flaxman (Planning, GIS & Visualization) Ben Discoe, Lead Developer, VTP (not pictured)
Study Area Location Southeastern China 2 hours SW of Shanghai
Hangzhou 2000 One of the Most Prosperous Cities in China 6 Million People Population Doubling in 20 Years 15X Auto Ownership Expected
Design Strategy • Conclusion of prior Harvard study: • To protect the West Lake, new development should be directed away from it and toward the river to the South. • Build New City Center Along River • Make this area more attractive to development than the edge of the West Lake
Basic Task: Propose & Evaluate Alternative Plans for Hangzhou 2020 Each Alternative Accommodates Projected Growth (Same Program) Evaluate the Visual, Economic & Environmental Consequences Present Results to the General Public in Form which Fosters Productive Discussion
Problem Summary • Design Challenge: How to Develop and Evaluate Compelling Alternatives for Large Urban Areas • Where to place strategic public investments in transportation infrastructure and civic buildings • Where to allow various land uses and densities / heights • Need to establish open space network planning • Technical Challenge: How to Visualize Alternative Futures for Large Cities and Regions • Efficiently generating models of current conditions • Visualizing multiple alternative plans in 3D • Visualizing detailed design in broader context • Workflow must facilitate “top down” design
Conventional Approaches to City Representation for Planning • Sketches -> maps • Single-use zoning representing classes of legally-permitted use • Building heights implicit in zoning
Problems with Conventional Representation • Nobody understands the maps except (perhaps) the planner • Basically too abstract: all concerned prefer representation with building massings to provide sense of scale • Two dimensional representation of a truly 3D problem
Visualization Goals: Visual representation of function, size and locations (not “realism” but “natural scene paradigm”) Represent some individual buildings and neighborhood patterns A good working model, not just a polished final rendering
Challenge #1: Number and Diversity of Elements Landscape Components Terrain Buildings Roads Vegetation Water Lighting/Atmosphere Any large landscape is likely to contain all of these components. The relative proportion will be location-specific, but each component needs an efficient representation.
Challenge #2: Interactivity Work done in parallel by 20 students working on PCs (single high-end visualization system not practical) Students and design critics need to be able to view work from any camera angle Design revisions should require editing at the level of the critique (changing zoning rather than manually moving 3000 buildings)
Potential RealtimeCity Visualization Approaches • GIS Visualization Systems • ArcScene, ERDAS VirtualGIS • Game Engines • VRML /GeoVRML • Commercial flight simulation generators • General conclusion • Many technical solutions were available, but no single available package was suitable for interactive city design with real GIS/CAD
Why The Virtual Terrain Project? • Supports most common GIS formats • CLOD terrain simplification allows realtime performance on normal PC hardware • Can generate buildings procedurally based on footprints • Integrates CAD models where available • Cross Platform • Open Source, so both free and extensible
VTP Foundations • Built atop three major libraries • Open Scene Graph • High Performance, OpenGL-based • Reads Many 3D Formats: OpenFlight, 3DS • wxWindows • Provides mature cross-platform GUI (Linux, Windows, MacOS) • GDAL (Geographic Data Abstraction Library) • Reads/writes most GIS formats • Deals with Map Projections
VTP Visualization Process • Establish data meaning & representation options • Using “Builder” for 2D GIS/Image Data • “Culture Editor” for 3D and proxies • View/Edit Using Runtime “Enviro”
Production Pipeline 1: Base Data • Current Conditions • Base data from 1m satellite scene • Existing building footprints from 1:1000 CAD • Elevation from 1:10K contours + spot elevations
Production Pipeline 2: Buildings • Developed Building Typology • Developed custom ArcView scripts to place template building footprints with attributes • Generic buildings derived procedurally from footprints in Builder • Custom buildings/bridges developed in CAD / surfaced in 3DS. Insert locations specified in GIS.
Production Pipeline 3: Terrain & Ground Cover • Grading plans developed in GIS using ArcView Tin • Surface cover changes specified in GIS • Exported from GIS as an image file (BMP)
Production Pipeline 4: Vegetation • Planting plans done by landscape architects in GIS (placing stems + plant ID attribute) • Street trees generated procedurally in GIS based on road type
Results: Process • Efficient: Four plans in four weeks • “a good plan is a done plan” • Students with no prior 3D visualization experience were able to productively use the tools • Effective: Visualizations influenced design choices • Building densities of first round proposals “looked like Cleveland” so adjusted upward • Visualization of greenspace and street trees had large impact in public reviews in China
Results of “GIS Templates to 3D” Strategy • Strengths • Efficient for large areas • Good, cleanly-attributed data • GIS intermediate products useful • Weaknesses • No good tools for building footprint generation/alignment • Generating grading plans using ArcView very tedious • Some design best done in 3D.
Results: VTP Strengths • Supports all major landscape elements: • billboard vegetation, CLOD terrain • Procedural & CAD buildings • GIS integration facilitated top-down design and revisions • Simple navigation interface • Powerful real-time visualization technologies for work on standard commodity hardware
Results: VTP Weaknesses(for use in Interactive Planning) • Constraints on terrain size and ground plane resolution • Multiple file conversions required for some design changes (no auto-update/build) • Lack of integration of feature types (particularly roads & terrain) • GIS integration was “one way” (GIS->Vis) rather than “round trip” (no Vis->GIS)
General Conclusions about City & Regional Visualizations for Planning Use • Chosen technique must efficiently represent common objects types • GIS/database essential for effective real-world visualization creation/management • Procedural modeling greatly facilitates both creation and updates • Inter-object 3d topology/constraints very challenging
Next Steps • Beyond aesthetics - visualizing consequences • Economic, Biodiversity, Water Quality • Scenario Comparison Interface • Visualize differences using crossfade or split screen • Internet integration • Easy data acquisition from web map servers • Facilitate sharing of building models, ecosystems, etc. • Better pattern generation tools
For More Information… • On the Hangzhou Project: • http://www.gsd.harvard.edu/~gsd98mf2 • The Virtual Terrain Project • http://vterrain.org/
Future Directions • Interface Enhancements • Incorporate Viewpoint and Animation Path Enhancements • Ecosystem/vegetation import and setup • Improve dynamic scene updating in Enviro
Future Directions 2 • Better integration with GIS • Make VTP Client of OpenGIS Web Map Servers • Facilitate GIS <-> VTP Ground plane transfer • Allow edits in 3D, saving to GIS • Improvements to Procedural Generation • Dynamic modification of buildings based on attribute changes (currently only on import) • Semi-random placement with offset from linear features (buildings along road, vegetation along street, etc.) • Stratified random vegetation placement relative to terrain attributes
Future Directions 3 • Efficiency and Quality Enhancements • Support “Impostors” for buildings • Support tiled/paged terrain with textures • Higher-quality rendering modes for non-realtime use (or geomorphed with steady camera) • Focus on Community and Environmental Planning