Download
1 / 24
240 likes | 425 Vues
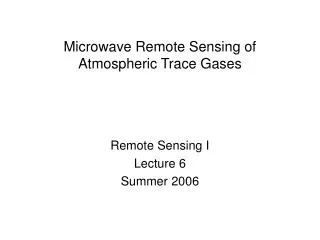
Ground and Satellite Observations of Atmospheric Trace Gases. George H. Mount Laboratory for Atmospheric Research WSU 13 April 2007. Outline. Aura/ OMI - O zone M onitoring I nstrument on the Aura satellite Aura ground truth/validation of data

E N D
Ground and Satellite Observations of Atmospheric Trace Gases George H. Mount Laboratory for Atmospheric Research WSU 13 April 2007
Outline • Aura/OMI - Ozone Monitoring Instrument on the Aura satellite • Aura ground truth/validation of data • MFDOAS instrument for urban airshed trace gas measurements and satellite validation • NASA INTEX B results, PNNL, spring 2006
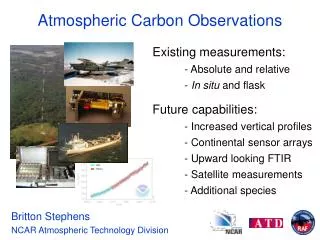
Aura/OMI • WSU involvement began in 1997 at the inception of the OMI project - Dutch instrument on NASA bird, small US team • double channel spectrograph covering 270 - 510 nm at 0.7nm resolution • launched in July 2004 • measures column O3, NO2, BrO, OClO, CH2O, SO2, aerosol indices • data products: • atmospheric column of above gases • trop NO2 • trop O3 - not yet routinely available • aerosol data
trace gas measurements: observing the Earth’s backscattered uv/visible radiation Sun Sunlight passes through the atmosphere, reflects off clouds and the surface, and is scattered back into the instrument field of view. Molecular spectral absorption is proportional to the concentration of the gas doing the absorbing along the path.
2-dimensional CCD swath wavelength ~ 580 pixels ~ 780 pixels flight direction » 7 km/sec viewing angle ± 57 deg 12 km/24 km (binned & co-added) 13 km 2600km )) Observing Principle for OMI
GOME Sciamachy OMI 1 TOMS single pixel size for four satellite instruments
OMI single pixel OMI pixel 12 km x 13 km superposed onto the Seattle airshed (zoom mode)
New WSU MFDOAS Instrument • WSU was funded 3 years ago to develop a new ground based instrument that would mimic the satellite measurements from the ground & support validation of the Aura satellite data from the ground • new instrument uses the molecular spectrum of the sky and direct sun as light sources for measurement of urban air pollution • scans the sky at low elevation angles where the tropospheric air mass is significantly enhanced • completing development at WSU as we speak • ground based campaign at NASA Goddard Space Flight Center 7-21 May • ground based campaign at NASA Jet Propulsion Laboratory 1-15 July • was fielded in prototype form during the NASA INTEX at Pacific Northwest National Laboratory in central Washington spring 2006
MF-DOAS: geometryfor sky-viewing mode stolen from Platt group
WSU MFDOAS instrument
WSU MFDOAS data during INTEX B at PNNL, Richland, WA
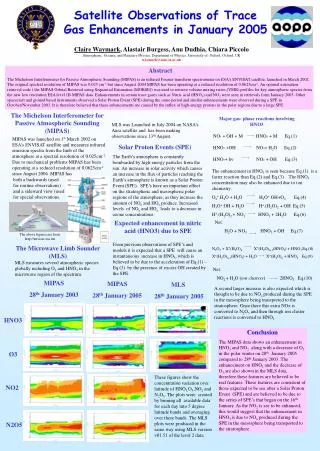
OMI data during INTEX over PNNL, WA spring 2006 comparison with MFDOAS shows a 20% bias between OMI and MFDOAS with OMI underestimating NO2 column. Other validations show a similar underestimate.
Things to consider in using satellite data: • basic limitations: • can only observe when clear - problem in Pacific NW in winter • tied to equator crossing time (1345h for Aura) for a polar orbiter • cannot get more than a couple of orbits of data before the urban area rotates • out of the FOV - orbital period ~ 90 minutes • cannot observe at night for most instruments • accuracy of the trop result depends on removing the strat overburden (if exists) • trace gases: • ozone and NO2total columns are done well from space • problem is the stratospheric overburden --> must separate strat/trop • this is not an easy problem - cloud slicing, use of other instruments onboard • RT codes have advanced this a lot in the last 5 years (spherical codes) • CO can be done fairly easily in the IR part of the spectrum • SO2 and HCHO are very hard due to low levels in the trop - few ppbv sensitivity • aerosols are measured by using uv radiances and work well • footprint size and model grid size • this has followed the technology with steady evolution to smaller footprints • 2-D detectors --> large advances in footprint and simultaneous large swath angle • OMI: 114° = 2600 km swath with 13 km pixels and a spectrum at central pixel • scanning mirrors are a thing of the past for swath coverage (perp. to orbital track)
temporal resolution • orbital period of ~ 90 min --> get a picture each period until airshed • rotates out of the swath - larger swath angles are better --> information • on multiple orbits • may take several days to build up an image due to spatial scanning swath • satellite moves at 7 km/sec --> ground track always moves at that speed • integration time to get good s/n - sets footprint in velocity vector • direction (NS) • short int. times produce low s/n, especially in the Huggins O3 bands • time to get complete global coverage - e,g, GOME 3d
Spectroscopic Technique for Air Pollution Measurements • measure the absorbed spectrum of sunlight reflected from the Earth’s surface • many tropospheric trace gases have complicated molecular spectra allowing • identification and quantification of concentration, e.g. • need a telescope to look down on the Earth • to collect light • to image the Earth surface onto the spectrograph over • a wide field of view (e.g. for OMI: 114° = 2600 km) at high • spatial resolution (e.g. for OMI: 12 km x 24 km pixel size in “global mode”) • spectrograph to sort out the molecular spectra • imaging detector which allows simultaneous detection ofa large spectral region for • each spatial resolution element over a wide swath of geography with high • spatial resolution. Older systems use a scan mirror to change the FOV. NO2 photoabsorption cross section [Harder, Brault, Johnston, and Mount, 1997]
basic physics is very simple • solar light traverses an atmospheric path: Sun --> Earth surface, then • reflecting Earth surface/clouds --> satellite sensor • measurement of spectrum of incoming light - solar irradiance spectrum • measurement of spectrum of light into sensor (reflected solar • spectrum from Earth = Earth radiance spectrum) • ratio of Earth radiance spectrum to solar spectrum • elimination of spectrum of solar spectrum (to first order) • reveals absorption spectrum of atmospheric molecules of interest • absorbance depth is proportional to the abundance of that molecule • along the absorption path • note: this is NOT a tropospheric concentration • technique only useful if there is “differential” absorption from • the molecule doing the absorbing - a smooth continuum spectrum with no • spectral structure only depresses the entire intensity of the spectrum
Current Satellite Data - TOMS, GOME, TES, MOPITT, Sciamachy • spatial footprint • currently operational satellite doing air pollution work • Sciamachy footprint: ~ 30 km x 60 km - scanning mirror for swath • GOME: ~ 80 km x 340 km - scanning mirror for swath • TOMS: ~ 50 km x 200 km - scanning mirror for swath • MOPITT: 22 km x 22 km - scanning mirror for swath - CO • TES: 5 km x 9 km: ozone • temporal resolution at time of overpass (typically about 1:30PM) • get a picture each orbit of 90 min duration when airshed underneath • with a large swath, get several orbits of data sequentially over airshed • with small swath, may take several days to build a picture (GOME -3d) • time of day is restricted: depends on equatorial time transit • e.g. for Aura, it is 1345 h --> obsv at same time of day each day
WSU MFDOAS data from PNNL during INTEX
DOAS Theory • Measure wavelength dependent light intensity (I[]) as light passes through the air mass • Initial intensity (Io []) decreases in the airmass due to • absorption by the trace gases, • scattering by molecules and aerosol particles • trace gases can be detected in the ratio of I [] to Io[] as a function of wavelength due to their unique absorption features
DOAS Theory: Beer-Lambert Law • Theory • Reality
Air Mass Factors: Geometrical Approach Total Slant Column Recent Developments in DOAS: an Overview. Ulrich Platt. Institut für Umweltphysik, Universität Heidelberg