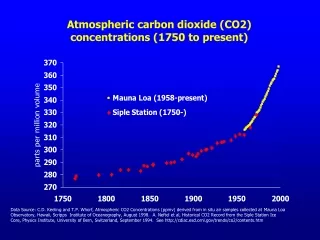
Atmospheric Carbon Observations
200 likes | 321 Vues
The study reviews existing methods for atmospheric carbon observations, focusing on both absolute and relative measurement techniques. Current technologies, like manometric and gravimetric methods, yield different accuracies in CO2 measurement, with significant advancements proposed for the future. The introduction of continental sensor arrays, upward-looking FTIR, and satellite measurements is anticipated to improve vertical profiling of CO2 sources and sinks. Additionally, the importance of assimilating new measurement types into existing frameworks is emphasized to better understand carbon fluxes across various regions.

Atmospheric Carbon Observations
E N D
Presentation Transcript
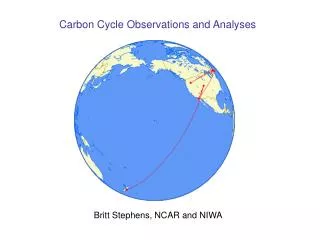
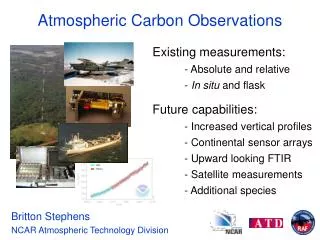
Britton Stephens NCAR Atmospheric Technology Division Atmospheric Carbon Observations Existing measurements: - Absolute and relative - In situ and flask Future capabilities: - Increased vertical profiles - Continental sensor arrays - Upward looking FTIR - Satellite measurements - Additional species
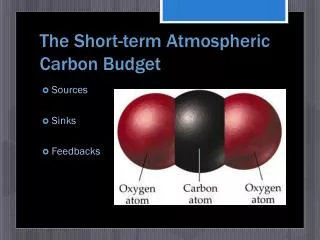
Atmospheric signals are small Rates of change in vertical column abundance for specific CO2 sources and sinks
Absolute Measurement Techniques: Manometric and Gravimetric NOAA/CMDL Manometer: Reproducibility of 0.06 ppm for dry mole fraction of CO2 (C. Zhao et al., 1997)
CMDL Flask Analysis System LiCor, Inc. CO2 Analyzer Relative measurement techniques:Infrared Absorption
Intra- and Inter-laboratory agreement still not better than 0.2 ppm [NOAA/CMDL]
13CO2/12CO2 and O2/N2 Ratios [R. Keeling, SIO] Independent constraints on the land-ocean partitioning of CO2 fluxes [NOAA/CMDL]
Expected from fossil fuel emissions What do existing flask measurements tell us? TransCom1 FF Gradients Observations
What don’t they tell us? • Longitudinal separation of continental sources • North America versus Eurasia • South America versus Africa • Regional fluxes on scales relevant to the underlying processes • Vertical distributions to improve flux constraints and to reject flawed models
Continental mixed-layer CO2 is highly variable TURC/NDVI Biosphere Takahashi Ocean EDGAR Fossil Fuel [U. Karstens and M. Heimann, 2001] [LSCOP, 2002]
Efforts coordinated by NOAA/CMDL Automated Flask Sampling Robust, Precise, CO2 Analyzer for Unattended Field Use • SBIR • Atmospheric Observing Systems • 0.1 ppm in one minute • Deployable for 6 months • Towers, buoys, ships, planes • Approximate cost: $20,000
Prototype Inexpensive/Autonomous CO2 System RMT, Ltd., Russia • Research items: • Stability of CO2 in aluminum LPG cylinders • Correction for zero drift between calibrations • Goals: • 1-2 year service schedule • Total installation ~ $3000 • 0.3 ppm accuracy
Upward Looking FTIR Spectrometry • Sun following spectrometer • Measure near infrared absorption of CO2 and O2 • Demonstrated precision in U.S. and Russia to ~ 1.5 ppm in 30 minutes • Could validate satellite measurements • Should be validated by airborne measurements Kitt Peak Observatory
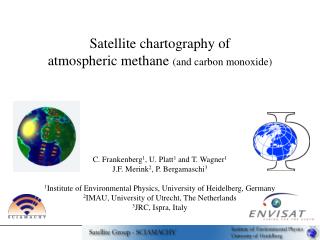
Satellite CO2 Measurements • Advantages: Dramatic increase in CO2 data, consistent global coverage, total column abundances, comparable to other datasets • Disadvantages: Potential for biases due to aerosols, clouds, land surface type, viewing angle, or sun angle, expensive • Existing or planned Techniques: • Thermal Infrared Emission – TOVS, AIRS, IASI (2005) • Available, but primarily mid to upper troposphere • Reflected Near Infrared – SCIAMACHY, OCO (ESSP Phase 2, 2006) • Targeted precision of better than 1 ppm for 4 x 5 degrees in 16 days
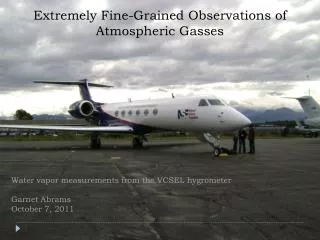
Additional measurement species Flask (+) and in situ (-) measurements from COBRA-2000, made during a descent into Boston, MA.
Using high frequency data makes signals bigger, but the annual-mean signals are still very small: To measure 0.2 GtCyr-1 regional source or sink to +/- 25%, need to measure annual mean surface gradients to around +/- 0.2 ppmand column gradients to better than 0.1 ppm Flux footprint, in ppm(GtCyr-1)-1, for a 106 km2 chaparral region in the U.S. Southwest (Gloor et al., 1999).
800 m 360 m 120 m Representativeness COBRA-2000 Daytime Profiles Total representativity error of mixed layer averaged CO2 mixing ratios (combined observational error and representativity error) plotted against the horizontal dimension of the region. Vertical bars indicate the 5-95% range. [Gerbig et al., submitted to JGR] S
Conclusions • Existing atmospheric measurements alone constrain fluxes of broad latitudinal zones • Room for improvement by assimilating multiple existing data types • Most significant advances will be from new measurement types and their assimilation • Systematic biases in and representativeness of data must be considered carefully