Download
1 / 11
110 likes | 259 Vues
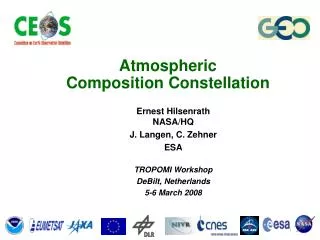
INTERPRETING SATELLITE OBSERVATIONS OF ATMOSPHERIC COMPOSITION . Spring 2010. Class Objectives: Familiarize ourselves with the basic techniques and measurements of composition made from space (Lectures) Learn to analyze and critically evaluate satellite data products (Labs). Pre-requisites:

E N D
INTERPRETING SATELLITE OBSERVATIONS OF ATMOSPHERIC COMPOSITION Spring 2010 • Class Objectives: • Familiarize ourselves with the basic techniques and measurements of composition made from space (Lectures) • Learn to analyze and critically evaluate satellite data products (Labs) • Pre-requisites: • Atmospheric Radiation (ATS 622 or equivalent) • Programming experience (assistance from Colette will be limited to IDL) Schedule: Lectures (ACRC 212b): Mondays 2-2:50pm Lab (ERC 210): Wednesday 2-4pm (lab booked until 5pm) Extra Lab time (ERC 210): Fridays 1-3pm
STRATOSPHERIC OZONE HAS BEEN MEASURED FROM SPACE SINCE 1979 Method: UV solar backscatter (absorption spectroscopy*) Last Monday’s ozone layer… Notice the Antarctic ozone hole l1 l2 Ozone layer Scattering by Earth surface and atmosphere *Technique originally applied to ground-based The satellite era for composition began with Nimbus 7 (launched Oct 1978) which carried LIMS, SAMS, SAMII, SBUV/TOMS (and others)
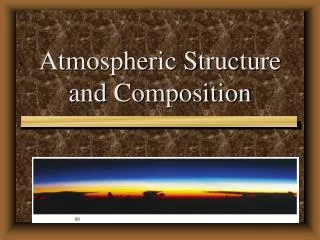
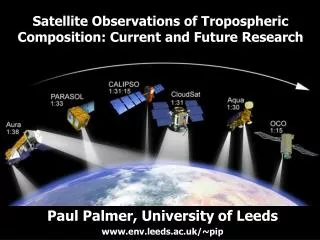
Mesosphere Stratopause Ozone layer Stratosphere Tropopause Troposphere ATMOSPHERIC COMPOSITION RESEARCH IS NOW MORE DIRECTED TOWARD THE TROPOSPHERE Air quality, climate change, ecosystem issues …but tropospheric composition measurements from space are difficult: optical interferences from water vapor, clouds, aerosols, surface, ozone layer
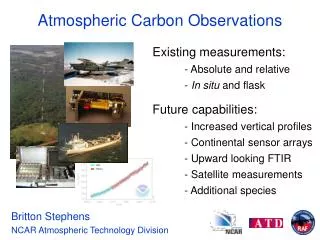
Global/continuous measurement capability important for range of issues: WHY OBSERVE TROPOSPHERIC COMPOSITION FROM SPACE? Monitoring and forecasting of air quality: ozone, aerosols Long-range transport of pollution Monitoring of sources: pollution and greenhouse gases Radiative climate forcing • solar backscatter • thermal emission • solar occultation • lidar FOUR OBSERVATION METHODS:
TROPOSPHERIC COMPOSITION FROM SPACE * Only in the UT
THERMAL EMISSION MEASUREMENTS (IR, mwave) Examples: MLS, IMG, MOPITT, MIPAS, TES, HIRDLS, IASI NADIR VIEW LIMB VIEW elIl(T1) T1 Absorbing gas • versatility (many species) • small field of view (nadir) • vertical profiling Pros: Il(To) To EARTH SURFACE • low S/N in lower troposphere • water vapor interferences Cons:
Examples: TOMS, GOME, SCIAMACHY, MODIS, MISR, OMI, OCO SOLAR BACKSCATTER MEASUREMENTS (UV to near-IR) absorption l1 l2 z l1 l2 wavelength Retrieved column in scattering atmosphere depends on vertical profile; need chemical transport and radiative transfer models Scattering by Earth surface and by atmosphere concentration • Daytime only • Column only • Interference from stratosphere • sensitivity to lower troposphere • small field of view (nadir) Pros: Cons:
OCCULTATION MEASUREMENTS (UV to near-IR) Examples: SAGE, POAM, GOMOS “satellite sunrise” Tangent point; retrieve vertical profile of concentrations EARTH • sparse data, limited coverage • upper troposphere only • low horizontal resolution • large signal/noise • vertical profiling Pros: Cons:
Examples: LITE, GLAS, CALIPSO LIDAR MEASUREMENTS (UV to near-IR) Pros: • High vertical resolution Laser pulse • Aerosols only (so far) • Limited coverage Cons: Intensity of return vs. time lag measures vertical profile backscatter by atmosphere EARTH SURFACE
GETTING STARTED WITH IDL & ENS SERVERS • Get ENS userid • Log on to ENS servers (either from ERC classroom or remotely using ssh & Xming or some other configuration) • Servers: linux<1-12>.engr.colostate.edu • lcompute<1-7>.engr.colostate.edu • Set up .Xdefaults and .cshrc files in home directory to your preferences (default option: copy those in ~heald/), including PATH information for IDL. • source .cshrc to refresh • Set up IDL copy over ~heald/IDL into your home directory (GAMAP routines, and idl_startup.pro information) • At the prompt anywhere type ‘idl’ to get started! • See examples of IDL code in ~heald/ATS681/idl_examples/