Change
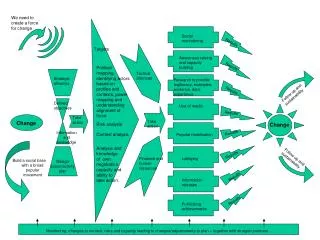
Change. Types of Graphs. Change. Change occurs when the properties or characteristics of a part of the environment have been altered. Humans can cause rapid and large scale change. Cyclic Changes : changes that repeat in time and space

Change
E N D
Presentation Transcript
Change Types of Graphs
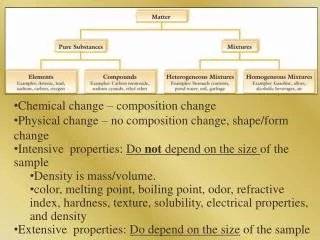
Change • Change occurs when the properties or characteristics of a part of the environment have been altered. • Humans can cause rapid and large scale change. • Cyclic Changes: changes that repeat in time and space • Prediction – a type of inference about the conditions and behavior of the environment in the future. • Cyclic changes can be predicted. • Not all change is cyclic • Examples: seasons, tides, lunar phases An example of noncyclic change is the occurrence of Earthquakes Ocean tides The phases of the moon The seasons of the year
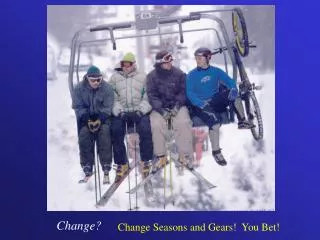
Cyclic Graphs • Predictable variables that repeat • Examples: • Seasons, lunar phases, tides • Predator prey relationships
Rate of Change • Rate of Change: how much a measurable aspect of the environment is altered (changed) over a given time. • This can be calculate – the equation is on page 1 of the ESRT. • Example: • In 1958 a mountain is 3000ft high. In 1998 the same mountain is 2920ft high. Calculate the rate of change. Round to the nearest whole number. • Rate of Change = Change in value/Time
Direct Relationship Graphs • When one variable increases, the other variable increases. • Examples: • mass and volume • More you study and higher test grades
Indirect Relationship Graphs • When one variable increases the other decreases • Examples: • Temperature and pressure • Temperature and density
Graphing • What things must all graphs have? • A title • Appropriate Scale • Labels on each axis with necessary units • Practice!