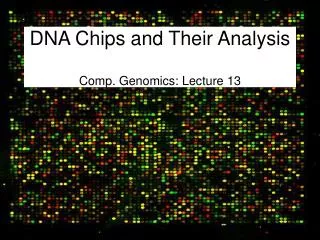
Intro to Comp Genomics
Intro to Comp Genomics. Lecture 7: Using large scale functional genomics datasets. Your Task. Your Task. Modeling. S. P1. Preparations: Get your hand on the ChIP-seq profiles of CTCF and PolII in hg chr17, bin-size = 50bp Cut the data into segments of 50,000 data points Modeling:

Intro to Comp Genomics
E N D
Presentation Transcript
Intro to Comp Genomics Lecture 7: Using large scale functional genomics datasets
Your Task Your Task Modeling S P1 Preparations: • Get your hand on the ChIP-seq profiles of CTCF and PolII in hg chr17, bin-size = 50bp • Cut the data into segments of 50,000 data points Modeling: • Use EM to build a probabilistic model for the peak signals and the background. • Use heuristics for peak finding to initialize the EM Analysis: • Test if your model for single peak structure is as good as the model for two peak structures. • Compute the distribution of peaks relative to transcription start sites P2 B P3 F P.. The model use k-states for the peak and one state for the background Use K=40.
Your Task Your Task Modeling Implement HMM inference: forward-backward Make sure your total probability is the same in the forward and the backward forms! Implement the EM update rules Run EM from multiple random points and record the likelihoods you derive Implement smarter initialization: take the average values around all probes with value over a threshold. Compute posterior peak probabilities: report all loci with P(Peak)>0.8 Preparations: • Get your hand on the ChIP-seq profiles of CTCF and PolII in hg chr17, bin-size = 50bp • Cut the data into segments of 50,000 data points Modeling: • Use EM to build a probabilistic model for the peak signals and the background. • Use heuristics for peak finding to initialize the EM Analysis: • Test if your model for single peak structure is as good as the model for two peak structures. • Compute the distribution of peaks relative to transcription start sites
Your Task Your Task Analysis • Compare the two peak structures you get (from CTCF and PolII) • Retrain a model together on the two datasets • Compute the log-likelihood of the unified model and compare to the sum of likelihood for the two models • Optional: test if the difference is significant by: • sampling data from the unified model • training two models on the synthetic data and compute the likelihood delta as for real data • Use a set of known TSSs to compute the distribution of peaks relative to genes Preparations: • Get your hand on the ChIP-seq profiles of CTCF and PolII in hg chr17, bin-size = 50bp • Cut the data into segments of 50,000 data points Modeling: • Use EM to build a probabilistic model for the peak signals and the background. • Use heuristics for peak finding to initialize the EM Analysis: • Test if your model for single peak structure is as good as the model for two peak structures. • Compute the distribution of peaks relative to transcription start sites
Functional genomics • 10 years after the appearance of microarrays, thousands of experiments were performed on different cells and conditions • One of the original promises of the technology is that it will for a vast body of data that can serve future modeling and analysis purposes • Standards have been established, and it is mandatory to deposit data high throughput datasets when publishing papers describing it • Unlike pubmed for literature or blast/blat for sequence, the functional genomics database is not usable using a single simple tool • We will discuss and practice some strategies for utilizing this powerful resource
NCBI - GEO Platform Sample Series
Data availability Gene expression: Different sets of genes or gene model! Still most of the data Conditions are critical GEO: 268,611 experiments (!!) 5343 platforms (Any species, condition, experiment) Mandatory submission for all published papers Also: EBI-Array express Challenge: find what you need Comparative genomic hybridization (aCGH): Important for disease with genomic aberrations TF binding profiles Old type: gene arrays Currently: Tiling array or ChIP-seq Specific databases are curated and organized: Species: e.g., SGD for yeast Disease: e.g., Oncomine for cancer – 28,800 arrays organized around specific cancer types Phenotype? Other specific assays?
Gene expression data is using different platforms (old cDNA, affy, new long oligo arrays) Vastly different gene sets and gene models RNA genes are now on most arrays Understanding the experimental conditions for each array is a challenge Avoiding replicates or using them smartly Be careful from systematic pre-normalization of original data – subtracting the median/mean from a specific dataset introduce a strong bias for all the arrays in it when compared to other datasets!
Transcription factor interactions, histone modifications maps: Histone modifications Genes bound by certain TFs Genes (or regions) enriched for specific histone modifications Hundreds of factors and modifications Different experimental conditions Abundant data for yeast,flies,mouse and human
Knock-down/knock-out library phenotype Library of mutants lacking each of the non-essential yeast genes is available (knockout) Essential genes can be knocked down using a sepcialized promoter Libraries can be automatiaclly screened for viability and/or growth rate in different conditions using robotics and 96/384 well plate formats Libraries of RNAi construct allow similar screens for worms and flies. Mammalian screens are becoming possible as well
Genetic interactions Testing the phenotype of multi-gene knockout provide key insights into the genetic network A gene may be essential fro growth under some condition, but become dispensable when another gene is knocked-down A mutation can be lethal only in the presence of another knockout (synthetic lethality) In yeast, systematic screens for synthetic lethality are practical for over 5 years.
Genetic interactions Improved technology provide more quantitative measurement of the growth phenotype of double knock-down Matching all pairs of a genes in a large subset of the genome is practical, and the resulted EMAP provide qunatitative estimate to the epistasis in the group (e.g., Schuldiner lab here at WIS)
Protein interactions Physcial interaction between proteins highlight post-translational regulatory networks and structural organization of key organelles Data comes from several technologies: most reliably techniques involving Mass spectrometry and isolation of protein complexes. Indirect techniques involving transcriptional assays (yeast-two hybrid) And more.. Data is partial and sometime difficult to interpret (what do we mean by interaction?) A large body of literature is dealing with speculation on protein network – relevance to actual biology is questionable…
Array CGH/genetic aberrations Data on deletion/insertion and copy number variation is generated by hybridization to arrays or more recently through sequencing Data is critical for studies of cancer . Databases also incule lists of genomic loci that are known to be instable in (specific types of) cancer.
Gene ontology Hierarchical vocabulary (GO terms) Unifying different research communities Annotations: association of term with gene in a specific species Also associating all super-terms GO-Slim is a flat version of the ontologies Process-… Function-… Component-..
The Mean So if your conditions are normally distributed, and pre-standartize to mean 0, std 1 You can quickly compute the sum of values over your set and generate a z-score Z-scores, T-test – the basics In a common scenario, you have a small set of genes, and you screen a large set of conditions for interesting biases. You need a quick way to quantify deviation of the mean For a set of k genes, sampled from a standard normal distribution, how would the mean be distributed? You want to test if the mean (RNA expression) of a gene set A is significantly different than that of a gene set B. If you assume the variance of A and B is the same: t is distributed like T with nA+nB-2 degrees of freedom If you don’t assume the variance is the same: But in this case the whole test becomes rather flaky!
Kolmogorov-smirnov statistics The D statistics distribution is given by a the form: An a-parameteric variant on the T-test theme is the Mann-Whitney test. You Take your two sets and rank them together. You count the ranks of one of your set (R1) The D-statistics is a-parameteric: you can transform x arbitrarly (e.g. logx) without changing it
Hyper-geometric and chi-square test A B Chi-square distributed with m*n-m-n+1 d.o.f.
Testing hypotheses on interaction graphs Given your gene set and a set of gene-gene or protein-protein interactions. How can you test if your set is enriched in intra- interactions? Criterion for an additional gene that is strongly interaction with your set? Are complex tend to be split by your set or maybe tend to be contained in the set? Node’s degree in the graph? Overall network density?
The iterative signature algorithm Matrix normalized for conditions Matrix normalized for conditions Simple statistics: Simple statistics: Plug in your favorite: Plug in your favorite:
The iterative signature algorithm Iterate until convergence (Small changes in gene/condition sets) Convergence is not guaranteed.. Try starting from your target gene set or from random sets. Thresholds are critical Variants: use a weighted average instead of plain average Allow signs for conditions Different statistics for thresholding (a-parametericKS/MW? Parameteric non-normal? Can you think of a probabilistic version? Simple statistics: Plug in your favorite:
A Probabilistic formulation Matrix normalized for conditions Pros and cons? Playing with the condition/gene means? Convergence?
Multiple-testing In many cases, your tests are not really independent For example, testing enrichment for functional annotations that are hierarchical Another example are multiple gene expression conditions that are very similar (same tumor type) You can estimate the empirical distribution of your statistics on random sets of the same size and use this as your p-value This should be done with care: making sure your sampled sets are really similar in nature to your true sets and controlling for effects you want to factor out. Testing for high mean of your gene set in 100,000 conditions in the database. You expect to get one case with p<0.00001 ! Stringent correction: multiply the p-value by the number of tests A rational alternative: control the false-discovery rate (FDR): 10 times “hits” than expected errors Go term 2 Go term 1 P-value cutoff
Your Task Your Task • Download the GNF human expression atlas from UCSC genome browser or GEO • Find 1-5 datasets on breast cancer in GEO • Combine IDs, merge the dataset • Download gene ontologies human associations. Extract gene set(s) related to apoptosis and to cell cycle. • Use your previous analysis of chromosome 17 to generate the set of 40 genes for which the 20k window containing their promoter had the lowest correlation to the overall k-mer spectrum • Also generate a set of 40 chr17 genes with the highest G+C content on the 1kb upstream their promoter (you can use the Genome browser tools for that) • Implement your version of the iterative signature algorithm (you are free to select the statistics you are using). You can implement the deterministic or probabilistic version. • Starting from the above gene set, see if and how your algorithm is converging. Compute the intersection of the converged set with the original sets and report the conditions you found • Change your algorithm parameters to get smaller or larger biclusters, plot the size of the resulted sets as a function of the parameter you are changing