Download
1 / 30
300 likes | 508 Vues
John W. Draper (1811-1882) Henry Draper (1837-1882). Solar spectrum, J. W. Draper 1840. Courtesy of Smithsonian Institution. Lunar rock and mineral mapping using public-domain software with Clementine and Lunar Prospector imagery: the Geological Lunar Research Group (GLR) Experience.

E N D
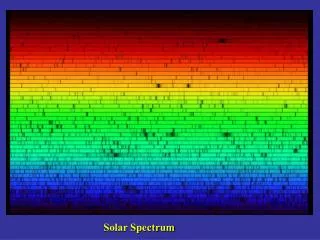
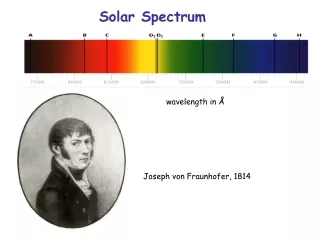
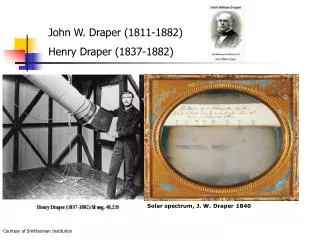
John W. Draper (1811-1882) Henry Draper (1837-1882) Solar spectrum, J. W.Draper1840 Courtesy of Smithsonian Institution
Lunar rock and mineral mapping using public-domain software with Clementine and Lunar Prospector imagery: the Geological Lunar Research Group (GLR) Experience Richard Evans, MD (GLR group)
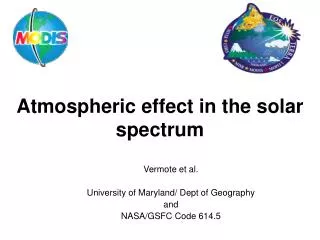
Atmospheric bands AVIRIS DATA
Copernicus Apollo 16 Multiplier: Soil sample #62231
Data Mining • Clementine UVVIS + NIR imagery • Lunar Prospector • Selene UVVIS + NIR imagery
Spatial Enhancement of LP Data using Clementine UVVIS+NIR imagery Matrix Regression: A x = b A = Coefficient Matrix (gain and offset values) X = Clementine spectral parameter map based comparison matrix B = Lunar Prospector elemental abundance map for a particular element
Method Development This general method was employed by Shkuratov UG et al. (2005) Planetary Space Sci 53: 1287-1301 but employed only Clementine 5 UVVIS spectra. The GLR method expands this to include the Clementine NIR global mosaic images and employes spectral parameter mapping of this data in the matrix regression. These modifications to the Shkuratov method were pursued in GLR primarily by Christian Wöhler, with the assistance of other GLR members and of Alexey Berezhnoy of the Sternberg Institute, Moscow. Initial results were recently published: C. WöhlerA. Berezhnoy and R. Evans (2009) Estimation of Lunar Elemental Abundances Using Clementine UVVIS+NIR Data. EPSC abstracts. Vol. 4.
Increasing spatial resolution of LP Data by Matrix Regression against Clementine based Spectral Parameter Maps Convert mxn Clementine spectral parameter and LP elemental abundance maps into 1 x n row vector matrices. Then: The matrix equation A*x=b is solved for x, the coefficient matrix. Then each Clementine row vector matrix and the ones matrix is multiplied by its corresponding coefficient and they are summed together. The resulting summation matrix is re-converted into a matrix of dimension mxn which will very closely approximate the original mxn LP matrix, but at much higher spatial resolution.
Solving the matrix equation A*x = b in Octave: A = mrdivide(B,x);
Motivation Lunar elemental abundance vs. multispectral data Lunar Prospector gamma ray spectro-meter data: Al [wt%] 150 km resolution Clementine UVVIS+NIR global mosaic 100 m resolution Basic Idea: Mapping of UVVIS+NIR data to LP GRS data based on matrix regression techniques
continuum Feature extraction from Clementine UVVIS+NIR data Continuum removal • Pixel-wise calibrated UVVIS+NIR spectrum (USGS Map-a-Planet) • Division of the original spectrum by the continuum line defined by the reflectances at 750 nm and 1500 nm (LeMouélic et al., 2000) • Akima interpolation
Feature extraction from Clementine UVVIS+NIR data Definition of spectral features (Evans et al., 2009) single absorption minimum two absorption minima 1.05 δ1 δ2 δ1 pyroxene with high admixed olivine content λ1 pyroxene FWHM λ2 FWHM λ1 inflection feature • Continuum slope (R1500 – R750) • FWHM of the absorption trough • λ1, λ2: Two absorption wavelengths between 890 and 1150 nm (identical values for single absorption) • δ1, δ2: Two relative absorption depths of the absorption minima (identical values for single absorption) • λ3, δ3: Wavelength and absorption depth of an olivine inflection feature δ3 pyroxene with low admixed olivine content FWHM λ3
Elemental abundances from spectral features Estimated abundances of Ca, Al, Fe, Mg, Ti, and O Ca (2 – 18 wt%) Mg (0 – 16 wt%) Al (0 – 20 wt%) Ti (0 – 6 wt%) Fe (0 – 25 wt%) O (40 – 47 wt%)
Petrographic Mapping from End-members defined by Elemental Abundances, Eimmart Crater Area Red: Mare Basalt Green: Mg Suite Blue: Anorthositic (FAN)
Basaltic Mapping based on Al & Ti defined End-Members, Eimmart Area Red: Mare Basalt Green: Highlands Blue: Ti enriched
Optical Maturity: OMAT OMAT = [ (R750 – 0.08)2+ (R950/R750 – 1.19)2 ]0.5