Promoting Ecosystem Restoration: Insights from the Regional Restoration Workgroup Meeting
The Regional Restoration Workgroup (RRWG) meeting held on July 20, 2010, gathered stakeholders to discuss the promotion of annual Gold and Silver level priority restoration projects across tidal marshes, bivalve shellfish, and urban waterfronts. Key outcomes included developing tools and matrices for project assessment, engaging public involvement, and ensuring effective decision-making for restoration activities. The RRWG aims to elevate high-ranking projects through the PDE Alliance, enhancing visibility for stakeholders and improving ecosystem benefits through strategic investments.

Promoting Ecosystem Restoration: Insights from the Regional Restoration Workgroup Meeting
E N D
Presentation Transcript
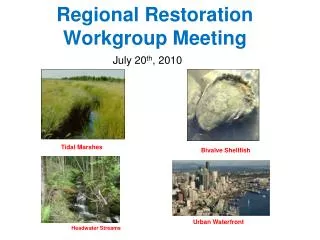
Regional Restoration Workgroup Meeting Tidal Marshes Bivalve Shellfish Urban Waterfront Headwater Streams Case Studies July 20th, 2010
Priority ProjectsAnnual Gold & Silver Level projects to be aggressively promoted Science Track Policy Track Public/Stakeholder Involvement [text] [text] [text] PDE ALLIANCE Selects and Promotes Priority Projects for annual Gold & Silver Level distinction PDE ALLIANCE RepsDraw on organizations’ technical resources/input & Public Comments for project selection 30 Day Public/ Stakeholder Comment Period Signature Species STAC - Regional Restoration Workgroup (RRWG)Develops tools, matrices, and natural capital values to assess projects from Registry. Annually picks high-ranking projects to elevate to PDE Alliance. Provides feedback on priorities and evaluation tools to the RRWG Urban Waterfronts Tidal Wetlands Headwaters Project RegistryCollects/values projects from throughout the Estuary and linked to decision-making tools Project RegistryAll projects in the Registry will have increased visibility for partners, stakeholders, and funders through a web-based clearinghouse. RRWG will promote Registry projects through other partnerships and initiatives. Project ImplementersProvide project information to RRWG (ideally through Registry)
Universe of Restoration Activities Existing Restoration Projects Reveal Project Gaps Smart Investments Rank Projects for Real Ecosystem Benefits Identify Highest Value Activities for Future Projects Valuation & Prioritization
Project Registry Website • “Landing page” for the searches: http://www.websketching.com/delawareestuary/search.html • New Project Submission Pages: Contact Info: http://www.websketching.com/delawareestuary/index.html Project Particulars: http://www.websketching.com/delawareestuary/page2.html Project Description: http://www.websketching.com/delawareestuary/page3.html Outcome & Implementations: http://www.websketching.com/delawareestuary/page4.html Issues Addressed & Benefits Realized: http://www.websketching.com/delawareestuary/page5.html Review & Submit Project: http://www.websketching.com/delawareestuary/page6.html
Wetlands Case Study- Basic Restoration Matrix No Opportunity Project with Opportunity Opportunity but No Project LE1 Habitats (examples) Living Resources (examples only) Ecosystem Services Storm Surge Protection Carbon Storage Restoration Opportunities Tidal Salt/Brackish Marsh Songbirds Raptors Nutrient Cycling Resident Streambed Diadromous Shorebirds Non-tidal Forested Mud Flat Oysters Blue Crabs Hard Bottom Open Water Macroinvts Mammals Herps Tidal / FW Marsh HSC FW Mussels Water Quality Water Quantity / Flow Protection Land Acquisition Legal / ESA Habitat Creation Augmentation/ improvement/planning Habitat Restoration& Enhancement Function Enhanced Restored Hydrology Fish Passage Fauna Enhancement Stocking Mgt/ Quotas Each circle will receive a unique cell code for use in the project directory & database. The Information shown contains examples only, to be refined in later stages of the RRI.
Headwaters Basic Restoration Matrix Cool Water Fisheries Support Nutrient Uptake Habitat/Spawning areas Stormwater Management Carbon Sequestration Flood Control Drought Resilience Recreation (i.e. bird watching) Regulation of Sediment Transport Ecological Services
Value-Added Restoration Matrix Kreeger
Value Added Restoration Matrix • Cost Table Activities: • Natural Capital Table Areas/Types • Multiplier for uplift percentage- define generic expected uplift % per activity type • To calculate generic project type value: Cost/acre x Uplift Multiplier x NC/acre = Score
Ex. Wetland VARM- Cost Table • $/acre to get to full functionality • Functionality score: • Low 1 • Medium • High 5 • To Find Costs/acre: Inventory research and vett with RRWG • Uplift %: Inventory researcy and vett with RRWG
Ex. Natural Capital Table cont. Benefits Carbon Sequestration Flood Protection Water Quality Trust $ Fish & Wildlife TOTAL FWT- PA Wetland Types FWT- NJ/DE Brack. Salt- NJ Salt- DE
Benefits/$ for Project Comparison NCV per acre