Download
1 / 14
140 likes | 262 Vues
This analysis delves into the performance of legendary NFL running backs, including Emmitt Smith, Walter Payton, Barry Sanders, Eric Dickerson, and Jim Brown. By examining each player's best five years, we focus on key metrics such as yards per game, touchdowns per game, and fumbles per attempt. Utilizing statistical tests, notably the 2-sample t-test, we determine whether these greats significantly outperform their peers. The results indicate a measurable distinction in performance, reinforcing the legacy of these iconic players in football history.

E N D
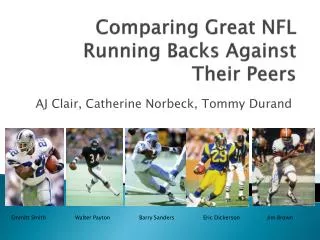
Comparing Great NFL Running Backs Against Their Peers AJ Clair, Catherine Norbeck, Tommy Durand Emmitt Smith Walter Payton Barry Sanders Eric Dickerson Jim Brown
What Makes A Running Back Great? • Yards • A running back’s ability to move the ball • TDs • A running back’s ability to score points • Fumbles • A running back’s ability to retain possession of the football
Method • Each running back’s 5 best years • Top 20 running backs from each year selected (all based on yardage) • Examined Yds/Game, TD/Game, Fmb/Att • We had 5 statistical values vs. 95 (19 players for 5 years) • Used 2-sample t-test to compare each running back with his peers
2-sample t-test • Used to analyze whether the difference in means between two independent groups of data is statistically significant • 1-sample t-tests are for measuring the difference in mean for a single group versus a hypothesized mean
Minitab • Open Barry Sanders.MTW
Yards/Game • Sanders p = 0.002 • Brown p = <0.000 • Dickerson p = 0.003 • Payton p = 0.004 • Smith p = <0.000
TD/Game • Sanders p = 0.039 • Brown p = 0.010 • Dickerson p = 0.028 • Payton p = 0.061 • Smith p = 0.012
Fumble/Attempt • Sanders p = 0.081 • Brown p = 0.065 • Dickerson p = 0.874 • Payton p = 0.132 • Smith p = 0.283
Conclusions • With the exception of fumbles, the five players we have indicated as being “great” are statistically significantly better than their peers in Yds/Game and TDs/Game except… • Walter Payton was the only player who was not statistically significantly better than his peers in TD/Game • In conclusion, there does appear to be a clear statistically significant separation in performance between great running backs and their peers
Tommy’s Approved* Method (Tommy Test) • Tommy modified well-known quarterback rating methods to account for the historical means in important running back statistics • Formula:
Tommy Test Results • Barry Sanders RBstat = .941380 • Jim Brown RBstat = 1.96347 • Eric Dickerson RBstat = .435718 • Walter Payton RBstat = .865737 • Emmitt Smith RBstat = 1.292
Compared to NBC rating • NBC • Brown • Sanders • Smith • Payton • Dickerson • Tommy Test • Brown • Smith • Sanders • Payton • Dickerson
References • www.Pro-football-reference.com • www.nbcsports.msnbc.com/id/6907909/page/5/ • http://books.google.com/books?hl=en&lr=&id=P2Hg1Tv1ZboC&oi=fnd&pg=PA15&dq=whos+the+best+nfl&ots=4PO3Clv42T&sig=URt7jCFpdt1QQjfT14XYe0ghphA