Download
1 / 43
430 likes | 778 Vues
EPI 5240: Introduction to Epidemiology Disease Classification; Vital Statistics; Measures of Mortality/morbidity September 21, 2009. Dr. N. Birkett, Department of Epidemiology & Community Medicine, University of Ottawa. Session Overview. Review basis of disease classification systems

E N D
EPI 5240:Introduction to EpidemiologyDisease Classification; Vital Statistics; Measures of Mortality/morbiditySeptember 21, 2009 Dr. N. Birkett, Department of Epidemiology & Community Medicine, University of Ottawa
Session Overview • Review basis of disease classification systems • Overview main measures of mortality and morbidity.
Traditional Epidemiology QuestionsReview • Who gets disease ‘X’? • Why did someone get disease ‘X’? • What is going to happen to someone who has disease ‘X’? • What can we do to prevent someone getting disease ‘X’? • What can we do to help someone with disease ‘X’? • Why are more (or fewer) people getting disease ‘X’ now than before? • Why do people living in ‘Y’ get more (or less) of disease ‘X’ than people living in ‘Z’?
Classification (1) • To answer questions like these, need to be able to group or classify people with similar conditions. • Can be hard • Focus on similarities • Focus on differences • Heterogeneity vs. homogeneity • E.g. Psychiatry vs. cancer
Classification (2) • John Graunt (1662) • Grouped deaths into common causes. • E.g. old age, consumption, smallpox, plague, diseases of teeth, worms • James Farr (1860’s) • Developed an early disease classification system.
Classification (3) • What features should be used as basis for classification? • Site of disease • Hot vs. cold • Yin/yan • Imbalance of the four humors • Behavioural vs. psychological constructs vs. biological neural factors • And so on.
Classification (4) • Main disease classification is the International Classification of Diseases and Related Health Problems (ICD). • Developed from Farr’s work with first version around 1900. • Up-dated about every 10 years. • Current: ICD-10 • ICD-9 is widely used in epidemiology
Classification (5) • ICD-10 • 21 major Chapters. • Based mainly on organ systems with no implied etiological value • Largely based on traditional diagnostic groupings but includes ‘external’ and other causes. • Heterogeneous • Manifestational vs. experiential classification • Each chapter is divided into paragraphs and sub-sections. • C34.4 – Lung cancer, lower lobe • I60.4 – Subarachnoid hemorrhage, basilar artery • V95.4 – Spacecraft accident injuring occupant
Classification – ICD10 (6) I. Infections and Parasitic Diseases (A-B) * II. Neoplasms (C-D) III. Diseases of blood &blood-forming organs (D) IV. Endocrine, nutritional and metabolic Diseases(E) V. Mental & Behavioural Disorders (F) VI. Diseases of the Nervous System (G) VII. Diseases of the eye and adnexa (H) VIII. Diseases of the Ear and Mastoid (H) IX. Diseases of the Circulatory System (I) X. Diseases of the Respiratory System (J) XI. Diseases of the Digestive System (K)
Classification – ICD10 (7) XII. Diseases of the skin (L) XIII. Diseases of the musculoskeletal system (M) XIV. Diseases of the Genitourinary system (N) XV. Pregnancy, childbirth, etc. (O) XVI. The Perinatal period (P) XVII. Congenital conditions, etc. (Q) XVIII. Symptoms, signs, NOS (R) XIX. Injury, poisoning (S-T) XX. External causes (V-Y) * XXI. Factors influencing health status and contact with health services (Z)
Classification (8) • Many other classification systems exist • Cancer • ICDO • Snomed • DSM • Impairments and disabilities • Conditions in Primary Care
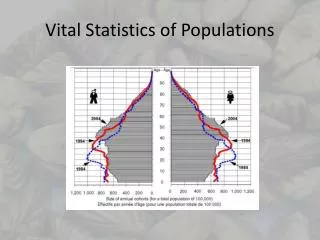
Vital Statistics • Information on main life events • Births • Deaths • Marriages • Usually collected by the local (municipal) level). • Reports sent to provincial government • Federal government (Statistics Canada) collates information into reports.
Mortality & morbidity measures (1) • Prevalence • More correctly: point prevalence • Similar to results from a political poll. • The probability that a person has a disease or condition TODAY. There is no time dimension. • ‘The prevalence of hepatitis C in intravenous drug users in Ottawa is 60%.’. This means that 60% of intravenous drug users in Ottawa have Hepatitis C.
Mortality & morbidity measures (2) • Incidence (general) • Measures the development of NEW cases of a disease or condition. • Requires a time dimension. Often this is given implicitly as ‘one year’. • Two types of incidence are recognized • Cumulative incidence or incidence proportion • Incidence rate or incidence density • Sorting this out is tricky and somewhat advanced. I’ll give you a simplified approach.
Mortality & morbidity measures (3) • Cumulative incidence or Incidence proportion • Measures the probability of developing a NEW case of a disease or condition in a set period of time. • ‘The cumulative incidence of esophageal cancer is 4/100,000 in one year.’ • The probability that an adult will develop esophageal cancer in the next year is 4/100,000
Mortality & morbidity measures (4) • Incidence rate (the hard one) • Measures the rate at which people develop a NEW case of a disease or condition. • Person-time = # people X time spent at risk • Allows for ‘loss to follow-up’. • This is not a probability. It can take on any value from 0 to +∞. It has units: time-1 or cases/person-year. • ‘The Incidence Rate of influenza is 4 cases per 100 person-years’.
Mortality & morbidity measures (5) • ‘Rate’ is used very loosely in epidemiology. You need to know from context what is meant (e.g. prevalence rate). • You will see three broad types of ‘rates’. • Crude • Specific • Adjusted or standardized
Mortality & morbidity measures (6) • Crude mortality rate (crude death rate) • Mid-year population is usually used for denominator • The simplest rate used.
Mortality & morbidity measures (7) • Cause-specific mortality rate • Can also be specific to ‘sex’, ‘geography’, ‘age’, etc.
Mortality & morbidity measures (8) • Age-standardized mortality rate • A ‘fictitious’ rate designed for comparing groups which differ in their age distribution • the crude mortality is higher in Canada than in Haiti. Is the risk of dying really higher in Canada or is this due to the Haitian population being younger? • Will be discussed more later in the course. For now, just learn the name and purpose. • Can be adjusted for factors other than age.
Some important rates (1) Crude Birth Rate General Fertility Rate
Some important rates (2) Total Fertility Rate • Average number of children who would be born alive to a woman during her lifetime IF she were to pass through all her child bearing years conforming to the age-specific fertility rates for a given year. • Complex! Essentially, it estimates the number of children per women which would have been expected if the current fertility patterns had applied through-out her life.
Some important rates (3) Completed Fertility • Average number of life births per woman who has reached the end of her child bearing period. • Similar to Total Fertility Rate but is based on the actual fertility rates through-out a woman’s life-time rather than on assuming the rates are the same today. • Consider this graph:
Some important rates (4) • Traditionally, epidemiology has lots of rates related to pregnancy and child development Infant Mortality Rate • Excellent indicator of public health services. • High rates indicate unmet health/environmental conditions • Nutrition; sanitation; education • Widely used for international comparisons • Canada (2001): 4.9/1000 • Sierra Leone: >100/1,000
Some important rates (5) Maternal Mortality Rate • Can be strongly influenced by illegal abortions. • Increases with maternal age • In Canada, any maternal death is most likely due to medical negligence • Canada: 0.3/100,000 • Sierra Leone: 450/100,000
Some important rates (6) Live birth • Complete expulsion from the mother of a product of conception which breathes or otherwise show any sign of life after expulsion. One breath is enough. But, the umbilical cord must have been cut. Fetal Death • A death of the product of conception prior to the complete expulsion. There must be no sign of life post-expulsion. These definitions are controversial and not consistently used (e.g. early miscarriages; therapeutic abortions).
Some important rates (7) Stillbirth • There are at least three definitions used: • A fetal death occurring after a gestation of at least 20 weeks. • A fetal death occurring after a gestation of at least 28 weeks (the WHO definition when I last checked) • A fetal death occurring after a gestation of at least 20 weeks or with a fetus weighing more than 500 grams • Variation partly due to improvements in neonatal care/survival.
Some important rates (8) Life expectancy • Not really a rate but it fits in here. • The number of years which a person can expect to live • Usually reported by the media as life expectancy at birth (about 79 for men and 82 for women) • Can be used at any age. • Life expectancy at age 50 is the number of additional years the person can expect to live given they have survived to age 50.
Some important rates (9) Life expectancy (cont) • Computation is complex and uses life tables. We won’t get into it in this course • Is strongly affected by deaths in early childhood • This is the main reason why life expectancy was so low pre-1900 and is still low in developing countries • After reaching adulthood, there is less discrepancy between countries
Some important rates (10) Life expectancy (cont) • Why the increase over the 1900’s? • Marked reduction in early childhood mortality • Nutrition • Sanitation • Immunization • Decrease in infectious disease mortality • Nutrition • Sanitation • Housing • Immunization • antibiotics
Other Outcome Measures (1) • PYLLs • Standard mortality measures ignore the age of death • Our society values a death of a child ‘more’ than the death of an older person • PYLL’s weight deaths by the age they occur to show impact in a different way. • Generally, PYLLs rate acute illnesses and injuries, to younger people, as more important than chronic diseases
Other Outcome Measures (2) • PYLLs • For each death, establish the ‘expected’ age at death • Life expectancy • A fixed age (e.g. 75) [The most common approach] • Determine how many years of life have been ‘lost’ due to the death • Sum up over all deaths. • Died at age 30 75-30 = 45 PYLL’s
Other Outcome Measures (3) • QALYs • ‘Quality Adjusted Life Years. • The number of years of life added by an intervention adjusted for their ‘quality’ • ‘Normal health’ = 1.0 • ‘Dead’ = 0.0 • Use patient’s utilities to assign value to other states
Summary • ICD-10 is main classification system used • Three key measures of mortality/morbidity • Prevalence • Incidence proportion or cumulative incidence • Incidence rate • Other measures can be used • PYLLs • QALYs • Lots of ‘rates’ related to pregnancy • IMR • MMR