Download
1 / 5
50 likes | 166 Vues
U.S. DEPARTMENT OF THE INTERIOR FY2010 PERMANENT WORKFORCE DISTRIBUTION. Total permanent workforce 58,729 Two or More Races 1.0%. Data as of 9/30/2010. Prepared by DOI, Office of Civil Rights, 1/2011. FY2010 DOI Representation. Compared to National Civilian Labor Force. %.

E N D
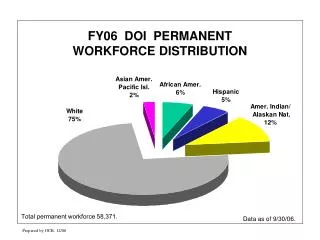
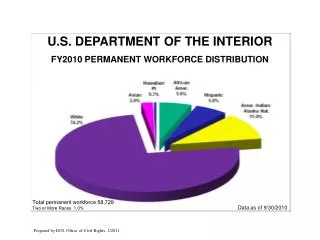
U.S. DEPARTMENT OF THE INTERIOR FY2010 PERMANENT WORKFORCE DISTRIBUTION Total permanent workforce 58,729 Two or More Races 1.0% Data as of 9/30/2010 Prepared by DOI, Office of Civil Rights, 1/2011
FY2010 DOI Representation Compared to National Civilian Labor Force % DOI% as of 9/30/10. NCLF% taken from 2000 Census. Codes: Wo-Women; W-White; B-Black; H-Hispanic; A-Asian; AI- American Indian/Alaska Native; HP-Hawaiian/Pacific Islander; M-men; W-women. Two or More Races – DOI 1.0%, NCLF 1.7%. 2010 Census data available in FY 2012. Prepared by DOI, Office of Civil Rights, 1/2011
& Persons w/Disabilities, GS-5 through SES FY2010 DOI Women, Minorities % Grades Data as of 9/30/2010. DOI permanent workforce is 89% general schedule employees; 51,366 in grades GS-5 through SES. Prepared by DOI, Office of Civil Rights, 1/2011
FY2010 DOI Accessionsby Race/Ethnicity/Gender % # Access.2,056 2,404 1,410 128 157 128 98 67 52 248 282 14 10 413 Data as of 9/30/2010. Accessions of Two or More Races men 44 (0.9%) and women 47 (0.9%). Accessions include new external hires and conversions of students and temporary employees to permanent status. Prepared by DOI, Office of Civil Rights, 1/2011
DOI Permanent Employment, FY2001-2010 # Data as of 9/30/2010. Two or More Races 598. Prior to FY06, Hawaiian/Pacific Islanders were included in Asian statistics. Prepared by DOI, Office of Civil Rights, 1/2011