FY06 DOI PERMANENT WORKFORCE DISTRIBUTION
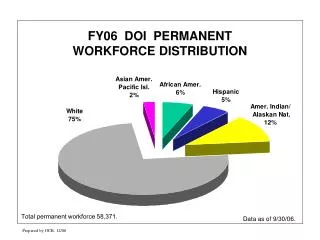
FY06 DOI PERMANENT WORKFORCE DISTRIBUTION. Total permanent workforce 58,371. Data as of 9/30/06. Prepared by OCR, 12/06 . FY06 DOI Race/National Origin . Actual Onboard as of 9/30/06. #.

FY06 DOI PERMANENT WORKFORCE DISTRIBUTION
E N D
Presentation Transcript
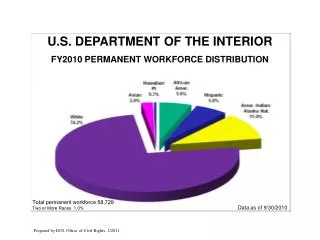
FY06 DOI PERMANENT WORKFORCE DISTRIBUTION Total permanent workforce 58,371. Data as of 9/30/06. Prepared by OCR, 12/06
FY06 DOI Race/National Origin Actual Onboard as of 9/30/06 # Total 2,765 9,669 5,801 5,528 7,638 15,955 8,262 365 521 1,609 258 As of 9/30/06, DOI’s permanent workforce totaled 58,371 employees. Prepared by OCR, 12/06
FY06 DOI Diversity Categories Pop. Change+270 -248 -308 -89 -462 -481 -261 -8 -7 -158 +19 -1,733 % From 9/30/05 to 9/30/06, DOI had a net decrease of -1,733 permanent employees. Population change is the net change in the number of employees in each bureau and DOI counting all races and national origin (RNO). Women include all RNO. Minorities include all minority men and women. Persons with disabilities include all RNO. Prepared by OCR, 12/06
FY06 DOI Accessions by RNO/Gender % Actual Access.1,546 1,524 1,042 85 136 92 76 44 46 189 246 238 Data as of 9/30/06. Accessions include new external hires and conversions of students and temporary employees to permanent status. Prepared by OCR, 12/06
FY06 DOI Voluntary Separations by RNO/Gender % Actual Sep. 1,752 2,207 1,209 114 162 121 86 56 52 239 243 325 Data as of 9/30/06. Voluntary separations do not include adverse actions and reduction-in-force. Prepared by OCR, 12/06
DOI Mission Critical Occupations Permanent Employees – FY06 # Series Total 3,731 3,397 1,045 963 810 1,622 932 79 Data as of 9/30/06. Series: 0025 Park Ranger; 0401 Biological Science; 0486 Wildlife Biology; 0810 Civil Engineering; 1170 Realty; 1315 Hydrology; 1350 Geology; and 1710 Education & Vocational Training. Prepared by OCR, 12/06
FY06 DOI Diversity Increasesin Mission Critical Occupations Pop. Change -69 -40 -60 -42 -51 -77 -52 -11 # From 9/30/05 to 9/30/06, DOI experienced increases in women and minorities within mission critical occupations. Population change is the net change in the number of employees in each of the mission critical occupations. Women include all races and national origin (RNO). Minorities include all minority men and women. Persons with disabilities include all RNO. Prepared by OCR, 12/06
FY06 DOI Minorities & Women White Collar Grades GS-5 through SES % Grades Data as of 9/30/06. 51,618 permanent employees in white-collar grades GS-5 through SES. White collar pay plans include GS, GM, GG, GH, ES, & EX. Women include all races and national origin (RNO). Minorities include all minority men and women. Persons with disabilities include all RNO. Prepared by OCR, 12/06
FY06 DOI Disabilities Permanent Employees Total Disab. 220 533 221 864 486 1,000 566 20 53 100 10 4,073 % As of 9/30/06, the permanent workforce had 4,073 employees with disabilities (7% of the workforce), of which 591 were employees with targeted disabilities (1% of the workforce). Prepared by OCR, 12/06
FY06 DOI Representation Compared to National Civilian Labor Force % DOI% as of 9/30/06. NCLF% taken from 2000 Census data and used to assess availability of minorities and women in the labor market. Women (Wo) include all races and national origin. Prepared by OCR, 12/06
DOI Permanent Employment Diversity Categories, FY04 - FY06 # Data as of 9/30/06. From 9/30/04 through 9/30/06, women decreased by 890 (3.7%), minorities decreased by 602 (3.9%), and persons with disabilities increased by 193 (5%). Women include all races and national origin (RNO). Minorities include all minority men and women. Persons with disabilities include all RNO. Prepared by OCR, 12/06
DOI Permanent Employment FY97 - FY06 # Data as of 9/30/06. Numbers are totals within each category only (not cumulative). Prepared by OCR, 12/06