Download
1 / 17
170 likes | 308 Vues
Dynamics at high redshifts:. the case of a cluster at z=1.47. Sandro Bardelli - INAF Osservatorio Astronomico di Bologna Christian Marinoni - LAM Marseille Angela Iovino - INAF Osservatorio Astronomico di Brera M.Scodeggio, O.Cucciati, O.Ilbert, M.Bolzonella, E.Zucca, C. Adami,

E N D
the case of a cluster at z=1.47 Sandro Bardelli-INAF Osservatorio Astronomico di Bologna Christian Marinoni - LAM Marseille Angela Iovino - INAF Osservatorio Astronomico di Brera M.Scodeggio, O.Cucciati, O.Ilbert, M.Bolzonella, E.Zucca, C. Adami, A. Zanichelli, L. Guzzo, L.Tresse, G.Zamorani, S.Arnouts, A.Cappi, L.Pozzetti, D.Bottini, B.Garilli, V.LeBrun, O.LeFevre, D.Maccagni, J.P.Picat, R.Scaramella, G.Vettolani, M.Arnaboldi, S.Charlot, P.Ciliegi, T.Contini, S.Foucaud, P.Franzetti, I.Gavignaud, H.J.McCracken, B.Marano, A.Mazure, B.Meneux, R.Merighi, S.Paltani, R.Pello`, A.Pollo, M.Radovich, M.Bondi, A.Bongiorno, G.Busarello, S.Temporin, D.Vergani, L.Gregorini, F.Lamareille, G.Mathez, Y.Mellier, P.Merluzzi,V.Ripepi, D.Rizzo
Fi Figure 1
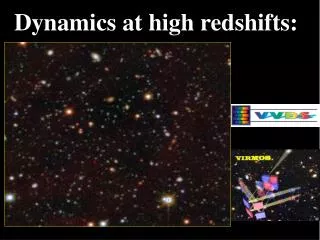
z=1.5 Figure 2 z=1.4 Thecluster at z=1.47 Figure 3
Figure 4 Spectroscopic redshift histogram in the cluster region
The deep F02 field of the VIMOS VLT Deep Survey (VVDS, PI Le Fevre) gives a unique possibility to study in depth (up to z~1.5) the large scale structure of the Universe (Figure1). This survey collected redshifts of galaxies to IAB<24 inan area of 0.4 x 0.4 deg2 . Moreover deep photometry is available in the UBVRIJK bands. Using the Voronoi Delaunay technique (Marinoni et al. 2002) on the spectroscopic sample, we detected a significant system of galaxies at z=1.47 (Figure 2). All spectra present features that assure good redshift determination (Figure 3). This structure has been detected because of the presence of 9 galaxies in a 7x7 arcmin region (corresponding to 3.5x3.5 Mpc). If we consider a wider region of 13x13 arcmin (6.5x6.5 Mpc), the number of concordant redshifts increases: in Figure 4 we show the redshifts histogram with the solid line representing the smoothed total redshifts distribution of the VVDS. No X ray emission has been found in a unfavourable XMM archive observation.
The UBVRIJK coverage of the F02 field permits to compute high quality photometric redshifts. In this figure (left) we performed an adaptive kernel filtering of the whole F02 area, by selecting objects with photometric redshift in the range [1.4 - 1.6]. Black points corresponds to galaxies with spectroscopic redshifts in the range [1.46 - 1.48], while red points correspond to a subclump of 5 very red galaxies. The structure has a dimension of about 8x6 Mpc. Figure 5
Figure 6 Figure 7
This structure lack of a definite color - magnitude relation. In Figure 6 we show the (I - J) - I color magnitude plot of galaxies in the cluster area. Triangles are galaxies with photometric redshift within the range [1.3 - 1.8], blue triangles are the red galaxies shown in Figure 5. Note that at z=1.47, M* of elliptical galaxies has a magnitude of IAB=25, while extreme blue galaxies have IAB=24.3 (Zucca et al, 2006) . The red band represents the expected position of the color - magnitude relation for red galaxies. In Figure 7 we show the color - color relation of the galaxies in the cluster region. Symbols are the same as in Figure 6, while the red lines correspond to the expected colors of a z=1.47 elliptical.
DISCUSSION: Cluster or Forming structure? This structure appears as an overdensity both in the photometric and spectroscopic redshifts and is formed by three subclumps and resemble the much more massive cluster complexes in the Shapley Concentration (Bardelli et al. 1998). The velocity dispersion of the central clump is 775 + / - 312 km/s (based on 9 galaxies within a region of 7’x8’) and is one of the most distant cluster known (with those found by Mullis et al. 2005 and Stanford et al. 2005 both at z=1.4). This structure does not present evident color - magnitude relation, but this is not surprising because it was found as a purely optical detection (see Donahue et al. 2002)
VVDS 0226-04 “cone” 6217 galaxies with secure redshifts, IAB24 Coverage on 30x30 arcmin² so far Current volume sampled: 3x10⁶ Mpc3 =1/16th of final goal 3000 Mpc