Download
1 / 14
140 likes | 282 Vues
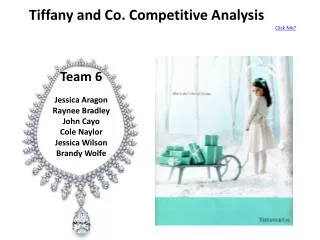
TIFFANY & CO. Crystal Curtis ACG2021.008. Executive Summary.

E N D
TIFFANY & CO. Crystal CurtisACG2021.008
Executive Summary After completing your analysis, write an executive summary of your conclusions here….Overall, Tiffany andco. improved from 2002 to 2003. Stock prices for this company are dropping. The company’s overall net income has increased $16,307 (in thousands) and gross profit increased $67,971 (in thousands). http://www.shareholder.com/tiffany/
Part A: Introducion • Chief Officer- Michael L. Kowalski • Location of home office- • 737 Fifth Ave. • New York, NY. 10022 • Ending date of latest fiscal year- January 31, 2004 • Description of the principal products or services that the company provides- The Company's merchandise offerings include an extensive selection of fine jewelry, timepieces, sterling silverware, china, crystal, stationery, fragrances and accessories. • Main geographic area of activity- Today, more than 100 TIFFANY & CO. stores and boutiques serve customers in U.S. and international markets.
Part A. Audit Report • Name of the company’s independent auditors. • PricewaterhouseCoopersLLP • In your own words, what did the auditors say about the company? The auditors say that Tiffany and company’s net sales increased 6% in 2002 after a 4% decrease in 2001. The company’s international sales are increasing.
Part A. Stock Market Information • Most recent price of the company’s stock- $38.97 • Twelve month trading range of the company’s stock • Dividend per share-0.16 • Date of the above information-February 16, 2004 • Your opinion about the company stock as an investment? BUY/SELL/HOLD- SELL
Part B. Industry Situation and Company Plans • The future of Tiffany and Co. is looking good. Last year their net sales rose 6%, net earnings rose 9%, and their return on average stockholder’s equity was 17%. Tiffany and Co. has been expanding their distribution and opened 2 stores internationally last year. They plan to keep expanding.
Part C. Income Statement • Is the format most like a single-step or multistep format?- Single-step • Insert a table showing the company’s gross profit, income from operations, and net income for the last two years. • In your own words comment on the increases and decreases in these amounts.- In each of the categories the amount has increased each year. Gross profit especially has increased.
Part C. Balance Sheet • Insert a table showing that Assets=Liabilities + Stockholders’ Equity for the past two years. • In your own words, comment in general on the increases or decreases in the balance sheet accounts. Which accounts changed the most? – Every account on the balance sheet increased with the year except for Prepaid Insurance and Income tax payable. Total current liabilities for 2003 decreased from 2002.
Part C. Statement of Cash Flows • Are cash flows from operations more or less than net income for the past two years? - More • Is the company growing through investing activities, i.e., buying property, plant and equipment and other long lived assets? – Yes, the company has bought more property. • What is the company’s primary source of financing, i.e., long-term loans, stock sales? Stock sales • Overall, has cash increased or decreased over the past two years?- Increased
Part D. Accounting Policies • What are the significant accounting policies, if any, relating to revenue recognition, cash, short-term investments, inventories, and property and equipment? • Revenue recognition- Sales are recognized when merchandise is sold over-the-counter or upon receipt of customer. Cash- The company’s policy restricts the amounts invested in any one bank. Inventories- inventories are valued at the lower cost or market. Property and equipment- Depreciation is calculated on an estimated usefulness of lives: buildings- 39 years, machinery and equipotent- 5-15 years, and office equipment and store fixtures- 3-10 years. • List the topics of the notes to the financial statements. The topics are about each account on the financial statements. Such as cash, investments, long-lived assets, expenses, etc.
Part E. Financial AnalysisLiquidity Ratios • For the past two years, calculate and comment on: • Working Capital= 2002 ($953,057-314,348= $638,709) • 2003 ($1,070,388-299,907= $770,481) • Current Ratio= 2002 ($953,057 / $314,348 = 3.03) • 2003 ($1,070,388 / $299,907 = 3.57) • Receivable turnover =2002($1,606,535/ $102,757.50 = 15.63) • 2003($1,706,602 / $105,794 = 16.13) • Average days’ sales uncollected= 2002(365/15.63 = 23.35) • 2003(365 / 16.13= 22.39) • Inventory turnover= 2002 ($663,058 / $631,685 = 1.05) • 2003 ($695,154 / $671,870.50 = 1.03) • Average days’ inventory on hand= 2002 (365/1.05=347.6) • 2003 (365 / 1.03= 338)
Part E. Financial AnalysisProfitability Ratios • For the past two years, calculate and comment on: • Profit margin= 2002 ($173,587 / $1,606,535 = 10.8%) • 2003 ($189,894 / $1,706,602 = 11.1%) • Asset turnover= 2002= ($1,606,535 / $1,099,707=1.5) • 2003= ($1,706,602 / $1,777,330=.96) • Return on assets= 2002 ($173,587 / $1,599,707= 10.9%) • 2003 ($189,984 / $1,777,330= 10.7%) • Return on equity= 2002 ($173,589 / $981,214 =17.7%) • 2003 ( $189,984 / $578,497=32.8%)
Part E. Financial AnalysisSolvency Ratio • For the past two years, calculate and comment on: • Debt to equity= 2002($594,129 / $1,036,945 = .6 times) • 2003($715,537 / $1,208,049 = .6 times)
Part E. Financial AnalysisMarket Strength Ratios • For the past two years, calculate and comment on: • Price/earnings per share (2001)= 39.58 / 1.31=30.21 (2002)= 39.58 / 1.19= 33.26 • Dividend yield (2001) = 21.820 / 39.58=55.1% (2002)= 23.315 / 39.58 = 58.9%