Download
1 / 106
1.06k likes | 1.08k Vues
Explore advanced concepts in FMRI data analysis such as event-related developments, hemodynamic latency, sensitivity, and design innovations. Detailed research on neuronal current imaging and its applications in various brain functions.

E N D
What more information can we extract from the FMRI time series? bandettini@nih.gov Peter A. Bandettini, Ph.D Unit on Functional Imaging Methods & 3T Neuroimaging Core Facility Laboratory of Brain and Cognition National Institute of Mental Health
Engineering Computer Science Physics Statistics Cognitive Science Physiology Medicine Technology Methodology Neuroscience Interpretation Applications
Diff. tensor Technology Mg+ 7T >8 channels 1.5T,3T, 4T EPI on Clin. Syst. Venography Real time fMRI EPI SENSE Nav. pulses “vaso” Local Human Head Gradient Coils Quant. ASL Z-shim Baseline Susceptibility MRI Dynamic IV volume Spiral EPI ASL Current Imaging? BOLD Simultaneous ASL and BOLD Multi-shot fMRI Correlation Analysis CO2 Calibration Methodology Motion Correction Latency and Width Mod Parametric Design Multi-Modal Mapping Surface Mapping Baseline Volume Free-behavior Designs ICA Phase Mapping Mental Chronometry Multi-variate Mapping Linear Regression IVIM Deconvolution Fuzzy Clustering Event-related BOLD models PET correlation Interpretation IV vs EV ASL vs. BOLD Layer spec. latency Bo dep. Pre-undershoot PSF of BOLD TE dep Resolution Dep. Excite and Inhibit Extended Stim. Blood T2 Post-undershoot Metab. Correlation Linearity SE vs. GE CO2 effect Optical Im. Correlation Hemoglobin Fluctuations NIRS Correlation Balloon Model Electrophys. correlation Inflow Veins Complex motor Applications Memory Imagery Emotion Language Children Drug effects Motor learning Tumor vasc. Mirror neurons BOLD -V1, M1, A1 Presurgical Ocular Dominance Attention Volume - Stroke Clinical Populations V1, V2..mapping Priming/Learning D Volume-V1 Performance prediction Plasticity Face recognition 36 82 88 89 90 91 92 93 94 95 96 97 98 99 00 01 02 03
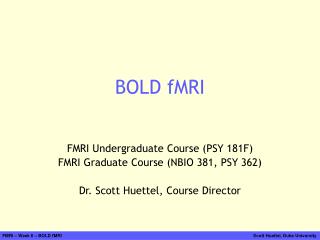
What more information can we extract from the FMRI time series? • Event-related developments • Linearity (Neuronal and/or Hemodynamic?) • Hemodynamic Latency • Sensitivity and “Noise” • Design and analysis innovations • Neuronal current imaging
What more information can we extract from the FMRI time series? • Event-related developments • Linearity (Neuronal and/or Hemodynamic?) • Hemodynamic Latency • Sensitivity and “Noise” • Design and analysis innovations • Neuronal Current Imaging
First Event-related fMRI Results Blamire, A. M., et al. (1992). “Dynamic mapping of the human visual cortex by high-speed magnetic resonance imaging.” Proc. Natl. Acad. Sci. USA 89: 11069-11073.
Visual Cortex ISI, SD ISI, SD 8, 2 20, 20 6, 2 12, 2 4, 2 10, 2 2, 2 P. A. Bandettini, R. W. Cox. Functional contrast in constant interstimulus interval event - related fMRI: theory and experiment. Magn. Reson. Med. 43: 540-548 (2000).
Motor Cortex ISI, SD ISI, SD 8, 2 20, 20 6, 2 12, 2 4, 2 10, 2 2, 2 P. A. Bandettini, R. W. Cox. Functional contrast in constant interstimulus interval event - related fMRI: theory and experiment. Magn. Reson. Med. 43: 540-548 (2000).
ISI Motor Cortex ISI Visual Cortex P. A. Bandettini, R. W. Cox. Functional contrast in constant interstimulus interval event - related fMRI: theory and experiment. Magn. Reson. Med. 43: 540-548 (2000).
ISI Motor Cortex ISI Visual Cortex P. A. Bandettini, R. W. Cox. Functional contrast in constant interstimulus interval event - related fMRI: theory and experiment. Magn. Reson. Med. 43: 540-548 (2000).
20, 20 12, 2 10, 2 8, 2 6, 2 4, 2 2, 2 Contrast to Noise Images ( ISI, SD ) S1 S2 P. A. Bandettini, R. W. Cox. Functional contrast in constant interstimulus interval event - related fMRI: theory and experiment. Magn. Reson. Med. 43: 540-548 (2000).
P. A. Bandettini, R. W. Cox. Functional contrast in constant interstimulus interval event - related fMRI: theory and experiment. Magn. Reson. Med. 43: 540-548 (2000).
SD = 4000 s. SD = 1000 ms. SD = 250 ms. Detectability: constant ISI SD – stimulus duration ISI – inter-stimulus interval Detectability 0 5 10 15 20 25 30 35 40 Average ISI (s)
Bandettini, et al., The functional dynamics of blood oxygenation level contrast in the motor cortex, 12'th Proc. Soc. Magn. Reson. Med., New York, p. 1382. (1993).
Detectability vs. Average ISI SD = 4000 s. Detectability SD = 1000 ms. SD = 250 ms. 0 5 10 15 20 25 30 35 40 average ISI (s) R. M. Birn, R. W. Cox, P. A. Bandettini, Detection versus estimation in Event-Related fMRI: choosing the optimal stimulus timing. NeuroImage 15: 262-264, (2002).
Estimation accuracy vs. average ISI 20 15 SD = 250 ms. Estimation Accuracy 10 SD = 1000 ms. SD = 4000 ms. 5 0 0 5 10 15 20 25 30 35 40 average ISI (sec) R. M. Birn, R. W. Cox, P. A. Bandettini, Detection versus estimation in Event-Related fMRI: choosing the optimal stimulus timing. NeuroImage 15: 262-264, (2002).
BOLD response motion task t fMRI during tasks that involve brief motion Blocked Design motion BOLD response task Event-Related Design R. M. Birn, P. A. Bandettini, R. W. Cox, R. Shaker, Event - related fMRI of tasks involving brief motion. Human Brain Mapping 7: 106-114 (1999).
Overt Word Production 2 3 4 5 6 7 8 9 10 11 12 13 R. M. Birn, P. A. Bandettini, R. W. Cox, R. Shaker, Event - related fMRI of tasks involving brief motion. Human Brain Mapping 7: 106-114 (1999).
motion t t Expected Response BOLD response Speaking - Blocked Trial R. M. Birn, P. A. Bandettini, R. W. Cox, R. Shaker, Event - related fMRI of tasks involving brief motion. Human Brain Mapping 7: 106-114 (1999).
avg avg Speaking - ER-fMRI Expected Response R. M. Birn, P. A. Bandettini, R. W. Cox, R. Shaker, Event - related fMRI of tasks involving brief motion. Human Brain Mapping 7: 106-114 (1999).
Tongue Movement Jaw Clenching
What more information can we extract from the FMRI time series? • Event-related developments • Linearity (Neuronal and/or Hemodynamic?) • Hemodynamic Latency • Sensitivity and “Noise” • Design and analysis innovations • Neuronal current imaging
time (s) Dynamic Nonlinearity Assessment Different stimulus “ON” periods measured linear BOLD Response Signal Stimulus timing 0.25 s 0.5 s 1 s 2 s 20 s Brief stimuli produce larger responses than expected R. M. Birn, Z. Saad, P. A. Bandettini, (2001) “Spatial heterogeneity of the nonlinear dynamics in the fMRI BOLD response.” NeuroImage, 14: 817-826.
8 f (SD) 6 4 2 0 10 20 30 40 0 1 2 3 4 5 0 10 20 30 40 Stimulus Duration -2 8 f (SD) 6 60 4 40 2 20 0 1 2 3 4 5 0 2 0 2 4 6 8 Stimulus Duration -2 nonlinearity Spatial Heterogeneity of BOLD Nonlinearity R. M. Birn, Z. Saad, P. A. Bandettini, (2001) “Spatial heterogeneity of the nonlinear dynamics in the fMRI BOLD response.” NeuroImage, 14: 817-826.
Results – visual task Nonlinearity Magnitude Latency R. M. Birn, Z. Saad, P. A. Bandettini, (2001) “Spatial heterogeneity of the nonlinear dynamics in the fMRI BOLD response.” NeuroImage, 14: 817-826.
8 f (SD) 6 4 2 60 0 10 20 30 40 0 10 20 30 40 40 0 1 2 3 4 5 Stimulus Duration 20 0 2 0 2 4 6 8 nonlinearity Results – motor task 8 f (SD) 6 4 2 0 1 2 3 4 5 Stimulus Duration
Results – motor task Nonlinearity Magnitude Latency
Reproducibility Visual task Motor task Nonlinearity1 Nonlinearity1 Nonlinearity2 Nonlinearity2 Experiment 1 Experiment 2 Experiment 1 Experiment 2
time (s) Different stimulus “ON” periods measured BOLD Response Signal linear Stimulus timing 2 s 3 s 4 s 8 s 16 s Brief stimulus OFF periods produce smaller decreases than expected
Sources of this Nonlinearity • Neuronal • Hemodynamic • Oxygen extraction • Blood volume dynamics Oxygen Extraction Flow In Flow Out D Volume
BOLD Correlation with Neuronal Activity Logothetis et al. (2001) “Neurophysiological investigation of the basis of the fMRI signal” Nature, 412, 150-157. P. A. Bandettini and L. G. Ungerleider, (2001) “From neuron to BOLD: new connections.” Nature Neuroscience, 4: 864-866.
100 a Response amplitude b 50 0 Stimulus Duration 0 1000 2000 3000 Results – constant gratings Simulation 3 Measured Amplitudes 2 a = initial slope Amplitude (%) 1 b = final slope 0 0 1000 2000 3000 200 Stimulus Duration (ms) Estimated Neuronal activity
MEG and Ramped Stimulus • 6 subjects • SD: 1 or 2 seconds • Ramp: 0, 0.5, 1 second • 8 Hz Counterphase-modulated checkerboards • Fixation without task • No blinking point • 45 repeats • 3 sec ISI • 275 channels • 600 Hz
MEG – Ramped stimuli Abrupt Stimulus Ramped Stimulus
Composite – 1 second Stimulus Duration No Ramp 0.5 second Ramp 1 second Ramp
Duty cycle effect…. Rapid event-related design with varying ISI 8% ON 25% ON 50% ON 75% ON
8% ON Measured Blocked Response 8% ON 25% ON 50% ON 25% ON Signal 50% ON 75% ON 75% ON Signal 0 10 20 30 40 0 5 15 10 time (s) time (s) Estimated Impulse Response Predicted Responses to 20 s stimulation
What more information can we extract from the FMRI time series? • Event-related developments • Linearity (Neuronal and/or Hemodynamic?) • Hemodynamic Latency • Sensitivity and “Noise” • Design and analysis innovations • Neuronal current imaging
sdelay = 107ms 1 run: 1% Noise 4% BOLD 256 time pts /run 1 second TR Number t -1000 -500 0 500 1000 delay estimate (ms) 500 400 16 sec on/off Smallest latency Variation Detectable (ms) (p < 0.001) 300 8 sec on/off 200 100 0 0 5 10 15 20 25 30 11 Number of runs
The major obstacle in BOLD contrast temporal resolution: + 2 sec Latency - 2 sec Magnitude Venogram P. A. Bandettini, The temporal resolution of Functional MRI in "Functional MRI" (C. Moonen, and P. Bandettini., Eds.), p. 205-220, Springer - Verlag,. 1999.