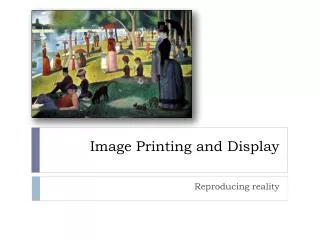
accuGray ™ Grayscale Calibration For Image Display Workstations
490 likes | 787 Vues
accuGray ™ Grayscale Calibration For Image Display Workstations. DICOM Grayscale Standard Display Function. accuGray. Scenario 1. Imagine the following:.

accuGray ™ Grayscale Calibration For Image Display Workstations
E N D
Presentation Transcript
accuGray™ Grayscale Calibration For Image Display Workstations DICOM Grayscale Standard Display Function accuGray
Scenario 1 Imagine the following: A trauma patient is admitted at an outpatient clinic or rural clinic at a remote location. Several X-rays are taken and sent to a hospital for consultation.
Scenario 1 How can we make sure that what the physician sees at the clinic matches what is being displayed on the radiologist softcopy workstation at the hospital? ? ? ? ?
Scenario 1 The image is also sent to another radiologist for a second opinion. This radiologist has a diagnostic viewing station from another vendor - a different monitor and video display card. As a matter of fact, he has a new flat panel display instead of a conventional CRT. How do we make sure that the image again looks identical? ? ? ? ? ?
Scenario 2 • Everyone misses something among the myriads of pixels that are tape archived for colleagues and lawyers to examine with 20/20 hindsight vision. • Perhaps the missed findings were apparent in the image data, but a once-new PACS monitor had lost its ability to display those subtle differences. • How can you know? What will you say when they ask what steps you took to assure that the display equipment you used was up to par?
Dicom Standard • These issues are addressed the Digital Imaging and Communications in Medicine (DICOM) standard (PS 3.14-2003) • Part 14 of this standard deals with grayscale consistency. • Jointly developed by American College of Radiology (ACR) & National Electrical Manufacturers Association (NEMA) • Standard method for transferring images and associated information • Allows images to be displayed consistently on different softcopy and hardcopy devices • devices manufactured by various vendors • devices having different technologies (CRT, LCD) • devices with different characteristics (max. Brightness and/or Density) • different ambient light environments.
CRT monitors (and LCD monitors which emulate them) have a fixed power-law relationship between output luminance and input drive signal (gamma) of about 2.5. output luminance = input drive2.5 Standard Windows signals or video signals applied to monitors require an inverse gamma offset to counteract the display’s gamma. An exact inverse correction produces a linear relationship between the driving signal and the resulting light output. Display Gamma
Display Gamma • Our eye-brain detection system is not linear • much less sensitive in the blacks than in the whites • why map all black values into luminance changes to display on the monitor when we can’t notice the differences between small black value changes? • DDL* values of darker areas mapped into large luminance increments • DDL* values of whiter areas mapped to smaller luminance increments • Resulting curve is standardized as the DICOM Grayscale Standard Display Function (GSDF) *Digital Driving Level (DDL): digital value applied to a Display System to produce a luminance output
Perceptual Linearization DICOM Grayscale Standard Display Function (GSDF) generates a display function matching the perceptual characteristics of a human observer. Standard developed having human observer view monitor while luminance output of monitor changed in small steps from black to white and noting when they observed a Just Noticeable Difference (JND) in light output as the drive signal is changed. This standard display function creates a perceptually linearized display - equal changes in driving levels yield perceptually equivalent changes in luminance across entire luminance range. From the observer’s point of view, this means that equal steps in brightness sensation represent equal steps in the acquired image data. Smallest luminance change that average person can just perceive under ideal circumstancesis approximately 256 shades of gray.
Perceptual Linearization Grayscale Standard Display Function 1000 100 10 1 200 400 600 800 1000 .1 .01 JND Index Equal steps in perceived brightness represent equal steps in the acquired image data Different change in absolute luminance Same number of Just Noticeable Difference == same perceived contrast
Perceptual Linearization Most digital radiologic images are windowed to attempt to display 256 different shades of gray at any one time, (256 is approximate JND that humans can perceive) The perceptual linearization implemented with the DICOM Grayscale Standard Display Function (GSDF) ensures that pixel values that are supposed to increase brightness in a linear fashion, say 6, 7, and 8, for example, actually appear that way to the human eye, despite the nonlinearity of our perception.
The DICOM GSDF provides a mechanism to standardize the appearance of images on monitors of different inherent brightness and with different response curves. Also recalibrate monitors whose luminance and response curves have changed over time. Now it is a matter of calibrating the monitor and printers according to this curve.Calibration tools for softcopy display devices include a luminance meter that can be placed on the monitor and allows the light output (luminance) to be measured at multiple digital driving levels (DDLs). This output can be compared with the actual Grayscale Standard Display Function (GSDF) and any differences can be calculated and saved. Once the differences are calculated, a corrective transfer function can be downloaded directly to the video display controller. Perceptual Linearization
Color Lookup Table Video Card Look Up Table • Digitized images are made up of a matrix of pixels, each possessing at least three dimensions: two (or more) spatial and one intensity value. The quantized dimensions are stored on the computer as a file of binary numbers. • In order to see the image on the computer monitor, the image pixel values must be mapped, one-to-one, to screen pixel values, via a Look Up Table (LUT). The LUT transfer function determines what screen values correspond to image pixel intensity values at all coordinates in the image.
Color Lookup Table 100 Standard 10 1 0 50 100 150 200 250 Characteristic Curve 0.1 DDL or P-Values • If each image intensity value is mapped to its corresponding screen value, the LUT is a linear function and can be graphed as a 45° straight line. • By modifying the transfer function’s slope & screen mapping, LUT image intensity values may be selectively increased or decreased to perceptually equalize image luminance steps. Linear Perceptually equalized
Guidelines for Calibrating Grayscale Monitors Calibrate each monitor regularly. Calibrate under regular viewing & lighting conditions. Adjust monitor contrast and brightness before/during calibration and never again. Calibrate with always the same background intensity (about 20%, or a value comparable to the average intensity emitted from the monitor). Calibrate to match the standard display function (DICOM). Calibrating Displays
Calibrating Displays accuGray™ Grayscale Calibration For Image Display Workstations
Four Primary uses of accuGray™ Acceptance Testing of new displays. Calibration to Grayscale and Color standards. Visual Verification of proper operation. Conformance Tracking over time. accuGray™ Grayscale Calibration
accuGray™ Grayscale Calibration Main Display screen
accuGray™ Grayscale Calibration Configuration screen
1. Acceptance Testing of new displays. Test new displays by evaluating critical test patterns and measuring luminance for white, black, and uniformity. You’ll select from these menu items
1. Acceptance Testing of new displays. Display SMPTE Pattern – analyze focus, geometry, smearing, luminance tracking.
1. Acceptance Testing of new displays. Display VeriLUM® Pattern – analyze 256 levels of gray, scan linearity, and focus.
1. Acceptance Testing of new displays. Display User Patterns – analyze display’s capabilities with standard or custom medical test images.
1. Acceptance Testing of new displays. Measure luminance for white, black, and uniformity.
1. Acceptance Testing of new displays. Measure White Level – tests display’s white output capability.
1. Acceptance Testing of new displays. Measure Black Level – tests display’s light output at a proper black level adjustment.
1. Acceptance Testing of new displays. Measure Luminance Uniformity – tests display’s capability to uniformly light screen from center to corners
1. Acceptance Testing of new displays. Measure Luminance – Perform general luminance & chromaticity measurements on a new display.
2. Calibration to Grayscale and Color standards. Calibrate display luminance and chrominance characteristics for accurate picture reproduction. You’ll select from these menu items
2. Calibration to Grayscale and Color standards. Measure Luminance Response for Gamma Correction – Calibrate display’s grayscale tracking to the DICOM standard.
2. Calibration to Grayscale and Color standards. Measure Luminance Response for Gamma Correction – Displays results compared to desired response curve.
2. Calibration to Grayscale and Color standards. Adjust Color Temperature – Calibrate display image white background color for accurate color rendition.
2. Calibration to Grayscale and Color standards. Adjust Color Temperature – View color calibration results in terms of 1931 or 1976 CIE Chromaticity Diagram.
3. Visual Verification of proper operation. Observe test patterns to confirm proper image geometry and optimum picture clarity. You’ll select from these menu items
3. Visual Verification of proper operation. Display SMPTE Pattern – analyze focus, geometry, smearing, luminance tracking.
3. Visual Verification of proper operation. Display VeriLUM® Pattern – analyze 256 levels of gray, scan linearity, and focus.
3. Visual Verification of proper operation. Display User Patterns – analyze display’s capabilities with standard or custom medical test images.
4. Conformance Tracking over time. Insure and document that a display continues to provide a properly calibrated image over its lifetime. You’ll select from these menu items
4. Conformance Tracking over time. Measure Luminance Response for Tracking - Measure a color display’s grayscale tracking and save to measurement history
4. Conformance Tracking over time. Display Tracking History - displays documentation of a color display’s white background color measurement history. Click for graphical Tracking and JND plots that show the display’s performance history
4. Conformance Tracking over time. History Plot – shows the current color Tracking measurement and past performance of the display.
4. Conformance Tracking over time. JND Plot - shows the current JND measurement and past performance of the display.
4. Conformance Tracking over time. Plot Results - provides on-screen and printable documentation of the display’s past and present performance.
4. Conformance Tracking over time. Gamma Correction Table - shows the current gamma curve and gamma history of the display.
4. Conformance Tracking over time. Calibration Luminance Response - shows the current luminance calibration curve and prior calibration curves.
4. Conformance Tracking over time. Tracking Luminance Response - shows the current luminance response and prior response curves.
Benefits of a Properly Calibrated Video Display: • Displays a sharper-focused, full resolution image • Shows full detail in both the darkest & brightest parts of all scenes • Is properly matched to the viewing environment • Produces a full range of accurate colors, including flesh tones • Minimizes picture artifacts (distortions) • Ensures a proper perceptually linearized display • Satisfied user (Doctor) • Properly diagnosed patient • No litigation
Questions? 1-800-SENCORE www.sencore.com