Download

1 / 13
130 likes | 316 Vues
Behind The Demand Curve I. 1.Marginal utility theory assumptions law of diminishing marginal utility optimal consumption critique 2. Uses of utility theory?. Uses. (i) Elasticity - determined by preferences. How quickly MU diminishes (ii) Efficiency - consumer surplus. Resource allocation

E N D
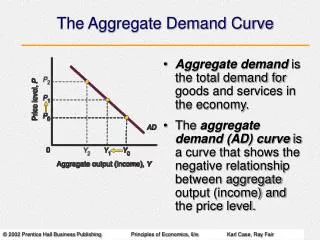
Behind The Demand Curve I • 1.Marginal utility theory • assumptions • law of diminishing marginal utility • optimal consumption • critique • 2. Uses of utility theory?
Uses • (i) Elasticity - determined by preferences. How quickly MU diminishes • (ii) Efficiency - consumer surplus. Resource allocation • (iii) Paradox of value - diamonds & water
Assumptions • Consumers are rational • Ceteris paribus • Cardinalist approach - utils • Utility = satisfaction (preferences)
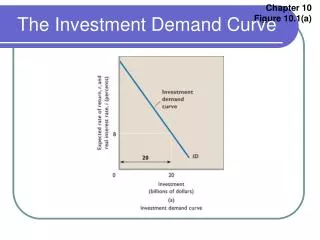
Measurement of utility • Total utility • “… the total satisfaction gained from the consumption of ALL units of a commodity.” • Marginal utility • “…the extra utility derived from the consumption of one more unit of a good, the consumption of all other goods remaining unchanged.” • See Figure 1-3 - shape & calculation
Utility from consuming cream cakes (daily) TU MU in utils No. of cream cakes TU in utils - 7 4 2 1 0 -1 0 1 2 3 4 5 6 0 7 11 13 14 14 13 Utility (utils) No. of cream cakes consumed (per day) fig
The Law of Diminishing Marginal Utility • Slope of the MU schedule • Definition • “…as the quantity of a good consumed by an individual increases, the marginal utility of the good will eventually decrease.” • Marginal analysis
Optimal consumption - background • Consumers have limited income. Choices. No saving • Rational consumer - maximise utility • Measurement problem - utils? • Solution: measure utility in money • price prepared to pay • price you actually pay
Optimal consumption - single good • Buy one extra unit when • MU > Price • MU (in monetary terms) = marginal benefit • Price = marginal cost • Stop when • MU = Price
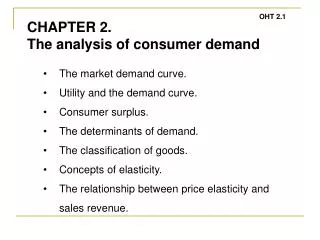
Optimal consumption - consumer surplus(CS) • Consumer surplus • Price prepared to pay - price actually paid • Marginal consumer surplus • MCS = MU - marginal expenditure • MCS = MU - P • i.e. the excess of utility over price • Buy more when MU > P (MCS positive). Stop MU = P
Derivation of the demand curve • Equals the MU curve as long as consumers maximise CS • If price falls: buy more since MU > P or MCS is positive • movement along demand schedule
a b Consumer surplus c Marginal utility from petrol MU MU, P (pence per litre) fig Q (litres per annum)
Optimal consumption - multi-good case • Equi-marginal principle • MUa \ Pa = MUb \ Pb = MUc \ Pc = … MUn \ Pn • If price of a good changes - reallocate income • If income is fixed • …utility is maximised when the utility from the LAST pound spent on ALL goods is equal
Uses • (i) Elasticity - determined by preferences. How quickly MU diminishes • (ii) Efficiency - consumer surplus. Resource allocation • (iii) Paradox of value - diamonds & water