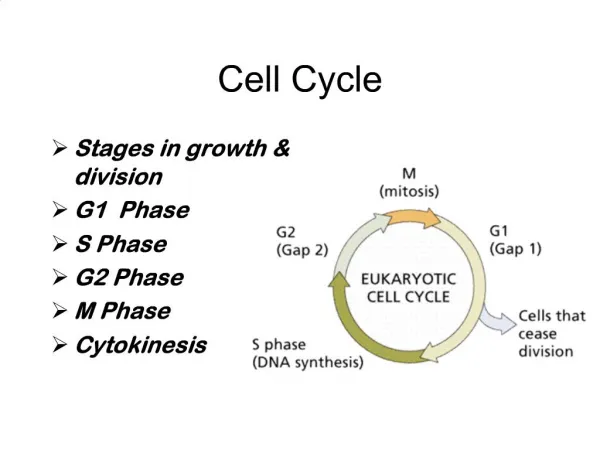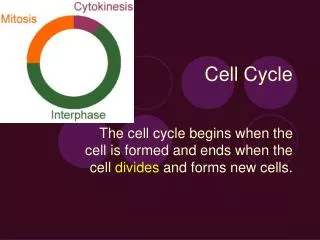
Cell Cycle Lab
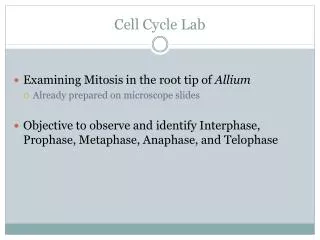
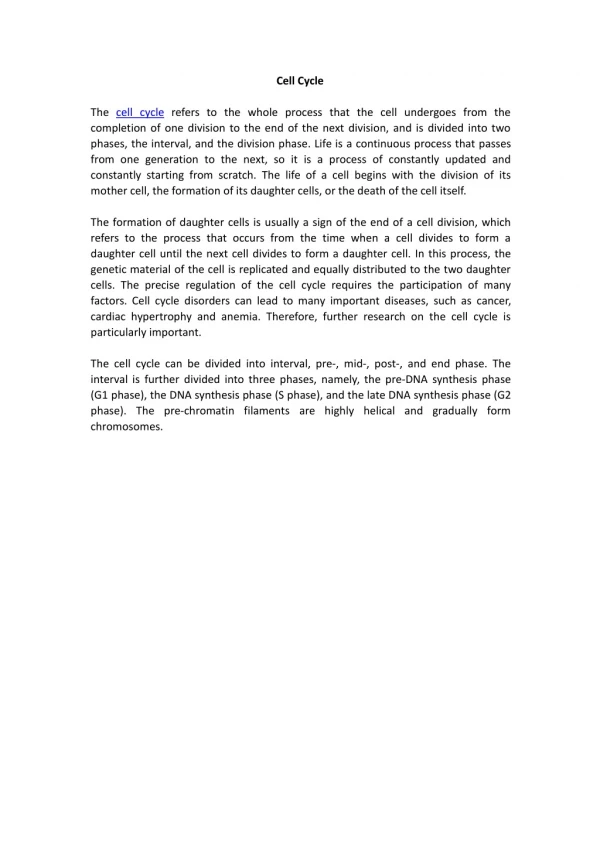
Cell Cycle Lab. Examining Mitosis in the root tip of Allium Already prepared on microscope slides Objective to observe and identify Interphase, Prophase, Metaphase, Anaphase, and Telophase. Mitosis Phases. Lab. Groups of 2 1 microscope per group 1 microscope slide per group


Cell Cycle Lab
E N D
Presentation Transcript
Cell Cycle Lab • Examining Mitosis in the root tip of Allium • Already prepared on microscope slides • Objective to observe and identify Interphase, Prophase, Metaphase, Anaphase, and Telophase
Lab • Groups of 2 • 1 microscope per group • 1 microscope slide per group • View slide at 40X • Count 100 cells • One group member will observe and one will mark done observations for 50 cells. Then switch and observe remaining 50 cells on a different part of the slide.
1 interphase2 interphase 3 early prophase4 mid prophase5 late prophase 6 metaphase7 early anaphase8 anaphase9 early telophase10 telophase
Microscope Usage • Handle microscope with 2 hands • One hand on the base and one hand holding arm of scope • Focus at 4X first • Only time you use course focus (large knob) • Then focus at 10X using fine focus (small knob) • Switch to 40X and focus using fine focus
Lab Make table of your small group’s observations: Pool class data into table Fill in excel document in class
Lab Report • Introduction: • Background about cell cycle • What are the stages and what is happening in each stage • Hypothesis • Relative amount of time spent in each stage
Lab Report • Methods: • Prepared slides • Count cells/ determine stage • Discuss calculations
Lab Report Results: Include table of class data for each phase Calculate mean, S.D., and S.E. of CLASS DATA for each phase Generate table of small group results
Lab Report • Calculate amount of time cells spent in each stage of mitosis. • Example: • Calculate percentage of time spent in a specific stage from class data • Interphase: 756/1200 X 100 = 63% • Use percentage to calculate time spent in stage • 16 hours (time it takes to complete cell cycle) x 0.63 = 10.08 hours • 0.08 hours x 60 minutes/1 hour = 4.8 minutes • 0.8 minutes x 60 seconds/1 minute = 48 seconds • Answer = 10 hours 4 mins 48 seconds in interphase
Lab Report • Calculate variability measurement Used to measure variability of class in determination of stages • Higher number indicates more variability • Use class data to calculate variability • Calculate for each stage • Variability = S.E./Mean
Lab Report • Results • Make pie chart of the percentage of time spent in each stage • Use class data for chart
Lab Report • Discussion • Meaning of lab • Why might certain phases take longer, etc. • Importance of cell cycle
Lab Report • Conclusion • Hypothesis supported? Why/ why not
Lab Report • Introduction • ___ Describe cell cycle • ___ Discuss cell cycle • Methods • ___ Counting • ___ What the numbers tell us • Results • ___ Class Data and Calculations (1.5 pts) • ___ Individual Data (0.5 pt) • ___ Pie Chart • ___ Conversion from percent to time • Discussion • ___ Discuss meaning of the lab • Conclusion • ___ Hypotheses