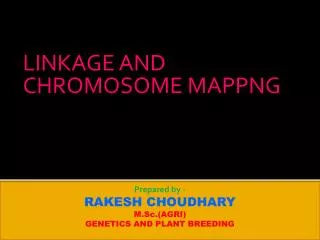
LINKAGE AND CHROMOSOME MAPPNG
410 likes | 763 Vues
LINKAGE AND CHROMOSOME MAPPNG. Prepared by - RAKESH CHOUDHARY M.Sc.(AGRI) GENETICS AND PLANT BREEDING. WELCOME. Linkage and Chromosome Mapping. Linkage and Chromosome Mapping.

LINKAGE AND CHROMOSOME MAPPNG
E N D
Presentation Transcript
LINKAGE AND CHROMOSOME MAPPNG Prepared by - RAKESH CHOUDHARY M.Sc.(AGRI) GENETICS AND PLANT BREEDING
Linkage and ChromosomeMapping Linkage and ChromosomeMapping
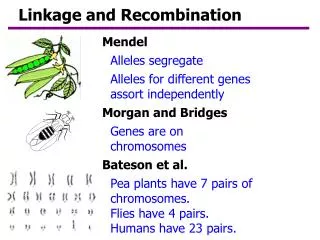
Genetic linkage was first discovered by the British geneticists William Bateson and Reginald Punnett shortly after Mendel's laws were rediscovered. The understanding of genetic linkage was expanded by the work of Thomas Hunt Morgan. Morgan's observation that the amount of crossing over between linked genes differs led to the idea that crossover frequency might indicate the distance separating genes on the chromosome. HISTORY Alfred Sturtevant, a student of Morgan's, first developed genetic maps, also known as linkage maps.
Alfred H. Sturtevant discovered the linkage of genes and made the first genetic map.
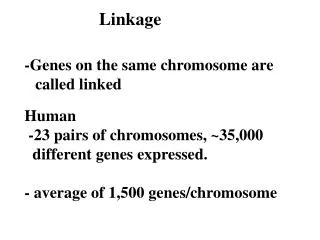
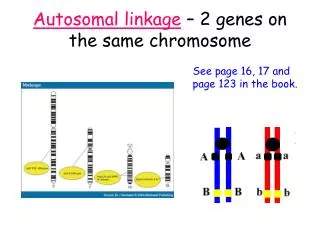
Terminology • Linkage - The presence of two or more genes in the same chromosome, which produces a tendency for parental traits to be inherited together or travel together. • Genes are units of heredity, whereas chromosomes are units of transmission. • Linkage may be complete, incomplete, or absent (not detectable), depending upon the distance between linked genes in a chromosome.
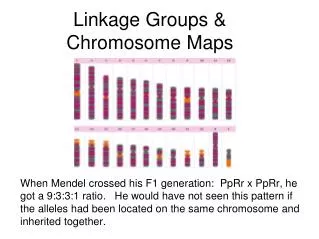
Linkage group. A group of genes inherited together --because they are in the same chromosome. In any organism,there are as many linkage groups as there are nonhomologous(haploid) chromosomes. Recombination- New combinations of linked genes that result after crossing-over. A B a B a b A b Parental Recombinant (new combination, (old combination) nonparental)
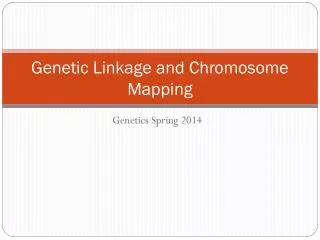
Genetic map. A line diagram showing the (linear) order of two or more linked genes and the distances between them. Map distance. % recombination between any two linked genes x 100. Map unit. 1 % recombination = 1 centi-Morgan (cM). This is approximately one million bp. in duplex DNA. Cytological map. A line diagram showing the actual physical distances between linked genes. Genetic and cytological maps have the same gene order but different map distances. a b c d Genetic map a b c d Cytological map
Example. Genes "a" and "b" are in the same chromosome: three possible scenarios (below). Linkage "a" and "b" are too close to each other. "a" and "b" are separated to allow crossing-over between them in up to 100% of meiocytes. "a" and "b" are too far apart to allow crossing-over between them in all of % of meiocytes. a b Complete linkage a <50 b In Complete linkage >50 a b Not detectable
Linkage map A linkage map is a genetic map of a species or experimental population that shows the position of its known genes or genetic markers relative to each other in terms of recombination frequency, rather than as specific physical distance along each chromosome. Linkage mapping is critical for identifying the location of genes that cause genetic diseases.
How Linkage violates Mendel’s Second Law A dihybrid testcross yields results that are not consistent with the expected 1:1:1:1 ratio. P Tall, Round x Dwarf, Pear (+ + / + +) (dd / pp) F1 Tall, Round (+ d / + p) Testcross + d / + p x dd / pp Observed Expected Tall, round 81 (4) 49.75 (1) Tall, pear 22 (1) 49.75 (1) Dwarf, round 17 (1) 49.75 (1) Dwarf, pear 79 (4) 49.75 (1) 199 199 If linkage If independent
Complete linkage Drosophila, bw (brown eyes) and hv (heavy wing vein) are closely linked and both wild types (red, thin) are dominant Cross homozygous bwhv+ with bw+hv homozygote F1 is bwhv+ /bw+hv (red with thin veins) F2 has only 3 phenotypes (not four) at a 1:2:1 ratio (brown, thin) : (red, thin) : (red, heavy)
Undetectable crossing-over or exchange Detectable crossing-over or exchange
Why Recombination cannot exceed 50%? because: a) Even if every meiocyte had a crossing-over between two linked genes, only 2 of 4 chromatids in a bivalent (tetrad) was involved in crossing-over. (2/4 = 50%)
Two-Point Crosses determine linkage, and distance between two linked genes. Cross parents differing with respect to the alleles of two linked genes, testcross the F1, and analyze the testcross progeny. Map Distance = Total Recombinants x 1oo (% recomb.) Total Recomb. + Parentals
Two-point crosses are good but not adequate; they have disadvantages. • Underestimate map distance when it is > 10 cM (double crossovers cancel each other). • Provide no information about relative positions of two linked genes. • Do not allow detection of double crossovers. Cure: Three-point crosses.
Three point test cross involves three gene. It helps to know the gene order or gene sequence to overcome two point test cross disadvantage. In three point test cross two single crossing over and double crossing over occurs between different genes.
Single crossover frequencies give distance between two loci but order can be more difficult to determine based only upon this type of data • Example of a double crossover using 3 marker loci are shown in Figure 5-7 • Frequency of a double crossover is expected to the the product of the two individual frequencies • Individual probabilities of 0.20 and 0.30 are going to both occur about 0.06 • For 0.03 and 0.02 you get 0.0006 (lots of flies to look over…)
LOD score method for estimating recombination frequency The LOD score (logarithm (base 10) of odds), developed by Newton E. Morton, is a statistical test often used for linkage analysis in human, animal, and plant populations. The LOD score compares the likelihood of obtaining the test data if the two loci are indeed linked, to the likelihood of observing the same data purely by chance. Positive LOD scores favor the presence of linkage, whereas negative LOD scores indicate that linkage is less likely. Computerized LOD score analysis is a simple way to analyze complex family pedigrees in order to determine the linkage between Mendelian traits (or between a trait and a marker, or two markers). NR denotes the number of non-recombinant offspring, and R denotes the number of recombinant offspring. The reason 0.5 is used in the denominator is that any alleles that are completely unlinked (e.g. alleles on separate chromosomes) have a 50% chance of recombination, due to independent assortment.
COINCIDENCE AND INTERFERENCE OBSERVED NO. OF DOUBLE CROSSSOVER COEFFICIENT OF CO-INCIDENCE (CC) = EXPECTED FREQUENCY OF DOUBLE CROSS OVER 0 < C C > 1 INTERFERENCE = 1 - cc
MAPPING FUNCTION Phenotypic recombination frequencies can be corrected to approximate cross over frequencies with a equation. It is curve between measured map distance against actual map distance. First mapping function- 1-HALDANE FUNCTION- proposed by J.B.S HALDANE X= 0.5log(1-2y) 2. KOSAMBI FUNCTION- proposed by D.D KOSAMBI X= 0.25 log(1+2y) (1-2y) Here x = estimate of actual frquency of c.o. y= phenotypic recombination frequency
THANK YOU For having a link to linkage 1