Analyzing Oglethorpe County Education Data: Insights and Comparisons (2012-2013)
This review examines the 2012-2013 educational data from Oglethorpe County, focusing on student performance across various grade levels, including CRCT and EOCT assessments. It highlights how Oglethorpe compares to state averages, identifies challenges, and explores the implications for college readiness and graduation rates. The data reveals critical areas needing attention, particularly among diverse student populations. The report advocates for cohesive strategies to enhance educational outcomes and address the systemic issues affecting student success in the region.

Analyzing Oglethorpe County Education Data: Insights and Comparisons (2012-2013)
E N D
Presentation Transcript
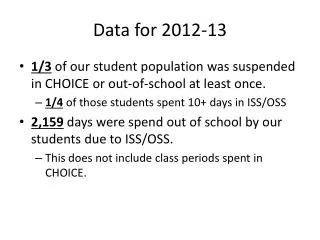
Data Review What is the data telling us about our system?
How do we compare? Oglethorpe Georgia
How do we compare? Oglethorpe Georgia
2013 EOCTNinth Grade Literature & Composition – Percentage Pass
2013 EOCTAmerican Literature & Composition – Percentage Pass
2013 EOCTEconomics/Business/Free Enterprise – Percentage Pass
Oglethorpe Georgia How do we compare?
What does our data tell us? Common Challenges: 1. 2. 3.
100 Georgia Public 9th Graders59 Graduate High School (adapted from Complete College America)
Complete College Georgia Initiative Meeting this goal requires increased participation from traditional student populations, as well as a wider pool of non-traditional student populations. “Creating a More Educated Georgia”
According to the University System’s Educational Needs Index… Oglethorpe County is classified as one of the most critical target counties with low college success (including technical college) high drop out, and low graduation.
Are we working together to address our challenges? Are we a system of independent schools? Are we a cohesive school system?


![Review [13]:](https://cdn2.slideserve.com/5360985/slide1-dt.jpg)