Download

1 / 49
490 likes | 629 Vues
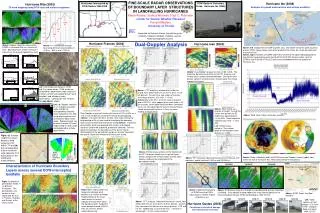
R. McTaggart-Cowan, L.F. Bosart and C. Davis. Numerical Simulation of Hurricane Alex (2004). Outline. Hurricane Alex (2004) background Easterly wave (EW) development Midlatitude interactions Operational NWP guidance evaluation Simulations of Hurricane Alex genesis

E N D
R. McTaggart-Cowan, L.F. Bosart and C. Davis Numerical Simulation of Hurricane Alex (2004)
Outline • Hurricane Alex (2004) background • Easterly wave (EW) development • Midlatitude interactions • Operational NWP guidance evaluation • Simulations of Hurricane Alex genesis • Development of tropical vortex • Spurious hurricane generation in the Gulf of Mexico • Summary and discussion
Storm Summary (Background) NHC Best Track • Formation from a tropical wave and cold upper low on 31 July • Hurricane status on 3 August and sustained Cat 1 force winds on the Outer Bank • Strengthens to Cat 3 storm at 38ºN 5 August SSM/I IR channel satellite image for ~1200 UTC 5 August (courtesy of FNMOC)
Easterly Wave (Background) Layer-averaged 925-850 hPa winds and relative vorticity from the 1º GFS analysis. Winds are shown in knots with short, long and pennant barbs indicating 5, 10 and 50kt winds, respectively. Vorticity is plotted at intervals of 2x10⁻⁵ s-1 above 1x10⁻⁵ s-1. E 0000 UTC 27 July
Easterly Wave (Background) Layer-averaged 925-850 hPa winds and relative vorticity from the 1º GFS analysis. Winds are shown in knots with short, long and pennant barbs indicating 5, 10 and 50kt winds, respectively. Vorticity is plotted at intervals of 2x10⁻⁵ s-1 above 1x10⁻⁵ s-1. E 1200 UTC 27 July
Easterly Wave (Background) Layer-averaged 925-850 hPa winds and relative vorticity from the 1º GFS analysis. Winds are shown in knots with short, long and pennant barbs indicating 5, 10 and 50kt winds, respectively. Vorticity is plotted at intervals of 2x10⁻⁵ s-1 above 1x10⁻⁵ s-1. E 0000 UTC 28 July
Easterly Wave (Background) Layer-averaged 925-850 hPa winds and relative vorticity from the 1º GFS analysis. Winds are shown in knots with short, long and pennant barbs indicating 5, 10 and 50kt winds, respectively. Vorticity is plotted at intervals of 2x10⁻⁵ s-1 above 1x10⁻⁵ s-1. A E 1200 UTC 28 July
Easterly Wave (Background) Layer-averaged 925-850 hPa winds and relative vorticity from the 1º GFS analysis. Winds are shown in knots with short, long and pennant barbs indicating 5, 10 and 50kt winds, respectively. Vorticity is plotted at intervals of 2x10⁻⁵ s-1 above 1x10⁻⁵ s-1. A E 0000 UTC 29 July
Easterly Wave (Background) Layer-averaged 925-850 hPa winds and relative vorticity from the 1º GFS analysis. Winds are shown in knots with short, long and pennant barbs indicating 5, 10 and 50kt winds, respectively. Vorticity is plotted at intervals of 2x10⁻⁵ s-1 above 1x10⁻⁵ s-1. A E 1200 UTC 29 July
Easterly Wave (Background) Layer-averaged 925-850 hPa winds and relative vorticity from the 1º GFS analysis. Winds are shown in knots with short, long and pennant barbs indicating 5, 10 and 50kt winds, respectively. Vorticity is plotted at intervals of 2x10⁻⁵ s-1 above 1x10⁻⁵ s-1. A E 0000 UTC 30 July
Easterly Wave (Background) Layer-averaged 925-850 hPa winds and relative vorticity from the 1º GFS analysis. Winds are shown in knots with short, long and pennant barbs indicating 5, 10 and 50kt winds, respectively. Vorticity is plotted at intervals of 2x10⁻⁵ s-1 above 1x10⁻⁵ s-1. A 1200 UTC 30 July
Easterly Wave (Background) Layer-averaged 925-850 hPa winds and relative vorticity from the 1º GFS analysis. Winds are shown in knots with short, long and pennant barbs indicating 5, 10 and 50kt winds, respectively. Vorticity is plotted at intervals of 2x10⁻⁵ s-1 above 1x10⁻⁵ s-1. A 0000 UTC 31 July
Trough Interaction (Background) T C E Dynamic tropopause (2 PVU) pressure (hPa) and deep layer shear. Shear is plotted in knots, with short, long and pennant barbs for 5, 10 and 50kt, respectively. Shear <20kt is plotted in blue.
Trough Interaction (Background) T C A E Dynamic tropopause (2 PVU) pressure (hPa) and deep layer shear. Shear is plotted in knots, with short, long and pennant barbs for 5, 10 and 50kt, respectively. Shear <20kt is plotted in blue.
Trough Interaction (Background) T C A E Dynamic tropopause (2 PVU) pressure (hPa) and deep layer shear. Shear is plotted in knots, with short, long and pennant barbs for 5, 10 and 50kt, respectively. Shear <20kt is plotted in blue.
Trough Interaction (Background) T C A E Dynamic tropopause (2 PVU) pressure (hPa) and deep layer shear. Shear is plotted in knots, with short, long and pennant barbs for 5, 10 and 50kt, respectively. Shear <20kt is plotted in blue.
Trough Interaction (Background) A E Dynamic tropopause (2 PVU) pressure (hPa) and deep layer shear. Shear is plotted in knots, with short, long and pennant barbs for 5, 10 and 50kt, respectively. Shear <20kt is plotted in blue.
Trough Interaction (Background) A Dynamic tropopause (2 PVU) pressure (hPa) and deep layer shear. Shear is plotted in knots, with short, long and pennant barbs for 5, 10 and 50kt, respectively. Shear <20kt is plotted in blue.
Trough Interaction (Background) A Dynamic tropopause (2 PVU) pressure (hPa) and deep layer shear. Shear is plotted in knots, with short, long and pennant barbs for 5, 10 and 50kt, respectively. Shear <20kt is plotted in blue.
Trough Interaction (Background) T C Dynamic tropopause (2 PVU) pressure (hPa) and deep layer shear. Shear is plotted in knots, with short, long and pennant barbs for 5, 10 and 50kt, respectively. Shear <20kt is plotted in blue. A E
Trough Interaction (Background) T C Dynamic tropopause (2 PVU) pressure (hPa) and deep layer shear. Shear is plotted in knots, with short, long and pennant barbs for 5, 10 and 50kt, respectively. Shear <20kt is plotted in blue. A
Trough Interaction (Background) C T Dynamic tropopause (2 PVU) pressure (hPa) and deep layer shear. Shear is plotted in knots, with short, long and pennant barbs for 5, 10 and 50kt, respectively. Shear <20kt is plotted in blue. A
Diagnosis (Background) • Easterly wave enhances convection as it moves towards the eastern Caribbean. • PV tail beneath a fold-over ridge over the central North Atlantic begins to interact with a digging trough over eastern North America. • As the wavelength between the troughs collapses, the deep-layer shear is reduced. • The shear vorticity maximum of the EW is stretched by convective warming to form Alex.
Operational Guidance (NWP) • NHC forecasts: • near-average track forecasting skill • well below-average intensity errors (200% of mean) • Numerical guidance: • compare 0-48h guidance from 0000 UTC 29 July 2005 initializations of GFS, Eta and CMC-R models • evaluate genesis skill based on 925-850 hPa layer-averaged relative vorticity since surface features are weak until long lead times • DT pressure is used to evaluate large-scale flow
T NCEP Global Analysis C T C X GFS Model 00h X E E 00 UTC 29 July T Eta Model 00h T C C X CMC Regional Model 00h X E E
C NCEP Global Analysis T T C GFS Model 24h A A X X E E 00 UTC 30 July T C Eta Model 24h T C CMC Regional Model 24h A A X
NCEP Global Analysis T T A A GFS Model 48h X X 00 UTC 31 July T Eta Model 48h A T A CMC Regional Model 48h X
Operational Guidance (NWP) • GFS: good 3D structures and track, but vorticity centre is significantly weaker than observed. • Eta: re-arrangement of DT perturbations leads to a baroclinic development and strong frontal features at 48-60h lead times. • CMC-R: rapid erosion of depressed DT as the model incorrectly intensifies the curvature EW component and strengthens it to Cat1 hurricane status by 48h.
Model Description (Simulations) • MC2 and GEM models initialized with NCEP Analysis (1º resolution) • Grid: 40km spacing (300x220 L30 grid) • Dynamics: Semi-Lagrangian advection • Physics: • Modified Kain-Fritsch convection • Moist kinetic energy closure for boundary layer • 5 category bulk microphysics
18 UTC 29 July NCEP Global Analysis C T C T GEM Simulation 18h • Trough interaction streng-thens over the next 12h as separation decreases. • Convective DT ridging is already separating the cutoff from the PV tail. A X X MC2 Simulation 18h C T A X
00 UTC 30 July C NCEP Global Analysis T C T GEM Simulation 24h • Convective development continues to re-arrange the larger scale flow. • Southern cutoff dis-appears in MC2. A X X MC2 Simulation 24h C T A
06 UTC 30 July C NCEP Global Analysis T A GEM Simulation 30h • DT features in GEM lost due to active convection. • Southern cutoff complete-ly lost in MC2, eliminating the shear-reduction mechanism. X MC2 Simulation 30h C T A
Shear Reduction (Simulations) • The shear reduction triggered by trough interaction is weak in both the GEM and MC2 simulations. Time series of shear averaged over a 4x4 degree box centered on the EW vorticity centre. Shear is computed as the vector difference between the DT and 850-925hPa mean winds.
Evaluation (Simulations) • Both simulation and mesoscale operational models show varying degrees of rapid breakdown of the coherent DT field at 18-30h. • Large-scale shear reduction by trough combin-ation is suppressed by flow re-arrangements. Are the models failing to handle the strongly nonlinear pattern (predictability problem), or are mesoscale physical processes adversely affecting the larger-scale flow?
Sensitivity Tests (Simulations) • Diagnostics indicate that shear reduction during genesis is driven by the large scale trough interaction well-described by dry dynamics. • The dynamical cores of the GEM and MC2 models are isolated and run as sensitivity tests. • Dry-dynamical predictability is good despite the strongly nonlinear nature of the initial state and early evolution of the system.
06 UTC 30 July C T NCEP Global Analysis C T GEM Core Simulation 30h • Troughs interaction is delayed by ~6h. • Evolutions of PV tail and digging trough structures are well represented by dry dynamics alone. X X MC2 Core Simulation 30h C T X
06 UTC 30 July C T NCEP Global Analysis • Troughs interaction is delayed by ~6h. • Evolutions of PV tail and digging trough structures are well represented by dry dynamics alone. GEM Simulation 30h X MC2 Simulation 30h C T
06 UTC 30 July C T NCEP Global Analysis C T GEM Core Simulation 30h • Growth of the incipient vortex is not expected in these tests since it is largely convectively-driven and inconsistent with the dry dynamical formulation. X X MC2 Core Simulation 30h C T X
Sensitivity Tests (Simulations) • Dry dynamics are responsible for the develop-ment and main-tenance of low shear during trough inter-action. Time series of shear averaged over a 4x4 degree box centered on the EW vorticity centre. Shear is computed as the vector difference between the DT and 850-925hPa mean winds.
Error Evaluation (Simulations) • The re-arrangement of the coherent initial DT features is consistent with incorrect convective triggering: • rapid destruction of DT depressions occurs on a 6-12h (convective) timescale • tropopause lifting is accompanied by an increase in lower-level relative vorticity • Comparison of the model precip fields and observed OLR shows errors in convection.
GOES-East OLR and GFS Analysis DT Pressure valid ~0600 29 July 2005 MC2 Simulated Rain Rates and DT Pressure after 6h of integration • Modelled convection under the cutoff PV tail fragments the feature and reduces the effectiveness of trough interaction/shear reduction processes.
GOES-East OLR and GFS Analysis DT Pressure valid ~1200 29 July 2005 MC2 Simulated Rain Rates and DT Pressure after 12h of integration • Modelled convection under the cutoff PV tail fragments the feature and reduces the effectiveness of trough interaction/shear reduction processes.
GOES-East OLR and GFS Analysis DT Pressure valid ~1800 29 July 2005 MC2 Simulated Rain Rates and DT Pressure after 18h of integration • Modelled convection under the cutoff PV tail fragments the feature and reduces the effectiveness of trough interaction/shear reduction processes.
GOES-East OLR and GFS Analysis DT Pressure valid ~0000 30 July 2005 MC2 Simulated Rain Rates and DT Pressure after 24h of integration • Modelled convection under the cutoff PV tail fragments the feature and reduces the effectiveness of trough interaction/shear reduction processes.
GOES-East OLR and GFS Analysis DT Pressure valid ~0600 30 July 2005 MC2 Simulated Rain Rates and DT Pressure after 30h of integration • Modelled convection under the cutoff PV tail fragments the feature and reduces the effectiveness of trough interaction/shear reduction processes.
GOES-East OLR and GFS Analysis DT Pressure valid ~1200 30 July 2005 MC2 Simulated Rain Rates and DT Pressure after 36h of integration • Modelled convection under the cutoff PV tail fragments the feature and reduces the effectiveness of trough interaction/shear reduction processes.
GOES-East OLR and GFS Analysis DT Pressure valid ~1800 30 July 2005 MC2 Simulated Rain Rates and DT Pressure after 42h of integration • Modelled convection under the cutoff PV tail fragments the feature and reduces the effectiveness of trough interaction/shear reduction processes.
Summary • The importance of trough interaction for shear reduction over Alex’s incipient vortex is investigated in operational NWP and simulations. • Higher resolution regional models poorly represented the upper-level flow. • Rapid increases in tropopause heights due to convection beneath the troughs led to fragment-ation and reduced the effectiveness of shear reduction compared to dry dynamical studies.
Conclusions • Upscale effects of the misrepresentation of meso- and convective scale features during Alex’s genesis lead to the erroneous destruction of DT features that in a dry dynamical setting act to rapidly reduce the shear over the developing system. More Generally: In a highly nonlinear flow, errors in mesoscale perturbations can be amplified rapidly by the larger scales. All forcings in this case must be small in amplitude and applied with caution – coarse resolution models may outperform their mesoscale counterparts by smoothly evolving the upper-level flow.