Download
1 / 50
500 likes | 621 Vues
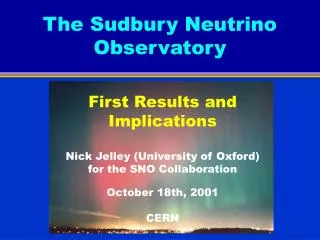
The Sudbury Neutrino Observatory. First Results and Implications Nick Jelley (University of Oxford) for the SNO Collaboration October 18th, 2001 CERN. Nuclear Fusion. pp 2 H + e + + e 2 H + p 3 He + 3 He + 3 He 4 He + 2p. pep 2 H + e. 3 He + 4 He 7 Be +

E N D
The Sudbury Neutrino Observatory First Results and Implications Nick Jelley (University of Oxford) for the SNO Collaboration October 18th, 2001 CERN
Nuclear Fusion pp 2H + e+ +e 2H + p 3He + 3He + 3He 4He + 2p pep 2H + e 3He + 4He 7Be + e + 7Be 7Li +e 7Li + p 24He p + 7Be 8B + 8B 8Be* + e+ +e 8Be* 24He
The enemy….. bs and gs from decays in these chains interfere with our signals at low energies And worse, gs over 2.2 MeV cause d + g n + p Design called for: D2O < 10-15 gm/gm U/Th H2O < 10-14 gm/gm U/Th Acrylic < 10-12 gm/gm U/Th
Water Purification and Assay MnOx224Ra, 226Ra extraction Purification decay products counted Assay of in electrostatic counters224Ra,226Ra HTiO Th, Ra, & Pb extraction Purification chemically stripped and Assay of counted with counter224Ra,226Ra,228Th Vacuum & Membrane Radon removal Purification De-gassingLucas Cells Assay of 222Rn Reverse Osmosis conc. collection Purification liquid scintillator Assay Ion Exchange & Ultrafiltration Purification
SNO Water Assays Targets for D2O represent a 5% background from d+g n+p Targets are set to reduce b-g events reconstructing inside 6m
Instrumental Backgrounds Note Neck Tubes Fired Electronic Pickup
External g-ray background u•r r3 <1%
How do we know this worked? Fraction of good events cut Mean angle between phototube hits Fraction of hits in a prompt time window Number of phototubes hit Contamination measured with independent cuts Signal loss measured with calibration sources
Signal Extraction Results 240.9 live-days between 11/99-1/01 No statistically significant differences between Blind and Open data sets (75 days/166 days) Data resolved into CC, ES, neutron components with Monte Carlo pdfs of Teff, cosqsun, (R/RAV)3 With the hypothesis of no neutrino oscillations CC 975.4 ± 39.7 events ES 106.1 ± 15.2 events Tail of Neutrons 87.5 ± 24.7 events
Radial Distribution Fiducial Volume Cut at 550 cm Nhit 65(no neutrons, no low energy backgrounds) Edge of AV is quite sharp. Events from D2O clearly identified. Bgnd Rise Acceptance drop
SNO cosqdistribution Electron Angle with respect to the direction from the Sun ES: strongly peaked CC: 1-1/3cosq Neutrons: isotropic
SNO energy spectrum from unconstrained fit Data points derived by fitting each energy bin independently Monte Carlo of undistorted 8B spectrum normalized to the data
SNO CC spectrum normalised to undistorted 8B spectrum Ratio to BP2001: 0.347 ± 0.029 No evidence for shape distortion (Adding syst. bin by bin in quadrature give c2 of ~12 for 11 D.O.F.)
Systematic Uncertainties N(HE g events): <10 events (68% CL)
Solar Neutrino “Fluxes” SNO: +0.12- 0.11 • CC (8B) = 1.75 ± 0.07 ± 0.05 • (stat) (sys.) (theory) • ES (8B) = 2.39 ± 0.34 • (stat) (sys.) SNO: +0.16 - 0.14 +0.08 - 0.07 Super-K* • ES (8B) = 2.32 ± 0.03 • (stat) (sys.) *S. Fukuda, et al., hep-ex/0103032 • Absolute fluxes from constrained fit:
“Flux” Differences • CC at SNO vs ES at SK ES - CC = 0.57 ± 0.17 3.35 effect • CC at SNO vs ES at SNO ES - CC = 0.64 ± 0.40 1.6 effect SNO SNO SK SK The hypothesis that this is a downward statistical fluctuation is ruled out at 99.96%
CC/SSM ratios for various solutions From Bahcall, Krastev, and Smirnov; hep-ph/0103179 SNO 3s For a Teff = 6.75 MeV threshold!
Energy Distortion in the Sterile VAC solution Sterile VAC predicts large energy distortion
SNO + Ga + Cl + S-K To Active Neutrinos To Sterile Neutrinos
Post-SNO 2 Active Oscillation Analysis Fogli et al. 21 June 2001
Implications of Neutrino Oscillations n1 n2 n3 ne n n Uml = Extension of Standard Model to Include Massive Neutrinos and Mixing Massive Neutrinos: • Will contribute a small component to the Missing Dark Matter in the Universe. Flavour Oscillations: Probe of models for new physics
Implications for 7Be Neutrinos SNO 8B rate = 0.347 0.029 SSM 37Cl rate = 0.34 0.03 SSM 8B contribution 76% 7Be contribution 15% So from SNO+Cl alone expect 7Be flux ~ 0.3 SSM
Fmt vs. Fe • SNO (8B) = 5.44 ±0.99 106 cm-2s-1 +SK +1.01 - 0.81 • SSM (8B) = 5.05 106 cm-2s-1 The Standard Solar Models are correct
Ratio of CC to ES 0.154 If SSM = 1000 produced and e = 340 detected Then since + = SSM e CC = 340& ES = 340 + 0.154(660) = 442 SNO S-K
Implications for Cosmology M(ne) < 2.8 eV(Bonn et al. - Mainz) Dm (atmospheric n) ~ 50 meV(assuming oscillations) (Toshito et al. Super-K) ~10-5 ≤ Dm (solar n) ≤ ~30 meV(SNO + Apollonio et al.) .05 ≤ SnMn ≤ 8.4ev 0.001 ≤ Wn ≤ 0.18
SNO’s Immediate Analysis Day/Night analysis hep-neutrino analysis Muons Seasonal and other Exotica NC from lower analysis threshold Shape Analysis from pure D2Odata
SNO’s Immediate Future NC Salt (BP98) Salt Injected 28 May 2001 Conductivity Measurements Taken During Salt Addition
SNO’s Future Analysis The separation of CC and NC events using the pdfs for the mean angle between hit PMTs
SNO Schedule • Now- Summer 2002 Salt data • Summer 2002- Autumn 2002 Pure D2O run • January 2003 - 2005 Neutral Current detectors • Summer 2005 SN-2005A
Conclusions • The SNO detector is working and taking beautiful data. • The CC rate measured in SNO is incompatible with the Super-K ES rate. • This is strong evidence (>99.8% c.l.) for the appearance of m or t neutrinos from the Sun. • Sterile and Just-So2 oscillations are excluded by these results at >99.8% c.l. • The 8B n flux from the Sun is now measured to be in agreement with the predictions of Standard Solar Models. • +Super-K+T2b decay 0.001 < Wn < 0.18
Outlook • These results are just the first of what SNO will produce. • The conclusions listed on the preceeding slide are systematics dominated. They will be severely tested by new measurements: • NC measurements in pure D2O • Day/night in pure D2O • The same measurements with NaCl added • The same measurements with the NCDs • It will be a very exciting time!
Solar Neutrino Problem 1968 Homestake 600 tonnes C2Cl4 e + 37Cl 37Ar+ e 1989 Kamiokande 2000 tonnes H2O e + e e + e 1990 Sage 1992 Gallex 90 tonnes Ga e + 71Ga 71Ge+ e 1998 Super-K 30000 tonnes H2O e + e e + e Solar Model, Experiments Or Neutrino Physics Wrong e or ?
S. Gil, J. Heise, R. Helmer, R.J. Komar, T. Kutter, C.W. Nally, H.S. Ng,Y. Tserkovnyak, C.E. Waltham. University of British Columbia T.C. Andersen, M.C. Chon, P. Jagam, J. Law, I.T. Lawson, R. W. Ollerhead, J. J. Simpson, N. Tagg, J.X. Wang University of Guelph J.C. Barton, S.Biller, R. Black, R. Boardman, M. Bowler, J. Cameron, B. Cleveland, X. Dai, G. Doucas, J. Dunmore, H. Fergani, A.P. Ferraris, K.Frame, H. Heron, C. Howard, N.A. Jelley, A.B. Knox, M. Lay, W. Locke, J. Lyon, S. Majerus, N. McCaulay, G. McGregor, M. Moorhead, M. Omori, N.W. Tanner, R. Taplin, M. Thorman, P. Thornewell. P.T. Trent, D.L.Wark, N. West, J. Wilson University of Oxford E. W. Beier, D. F. Cowen, E. D. Frank, W. Frati, W.J. Heintzelman, P.T. Keener, J. R. Klein, C.C.M. Kyba, D. S. McDonald, M.S.Neubauer, F.M. Newcomer, S. Oser, V. Rusu, R. Van Berg, R.G. Van de Water, P. Wittich. University of Pennsylvania Q.R. Ahmad, M.C. Browne, T.V. Bullard, P.J. Doe, C.A. Duba, S.R. Elliott, R. Fardon, J.V. Germani, A.A. Hamian, R. Hazama, K.M. Heeger, M. Howe, R. Meijer Drees, J.L. Orrell, R.G.H. Robertson, K. Schaffer, M.W.E. Smith, T.D. Steiger, J.F. Wilkerson. University of Washington R.G. Allen, G. Buhler,H.H. Chen* University of California, Irvine * Deceased J. Boger, R. L Hahn, J.K. Rowley, M. Yeh Brookhaven National Laboratory I. Blevis, F. Dalnoki-Veress, W. Davidson, J. Farine, D.R. Grant, C. K. Hargrove, I. Levine, K. McFarlane, C. Mifflin, T. Noble, V.M. Novikov, M. O'Neill, M. Shatkay, D. Sinclair, N. Starinsky Carleton University J. Bigu, J.H.M. Cowan, E. D. Hallman, R.U. Haq, J. Hewett, J.G. Hykawy, G. Jonkmans, A. Roberge, E. Saettler, M.H. Schwendener, H. Seifert, R. Tafirout, C. J. Virtue. Laurentian University Y. D. Chan, X. Chen, M. C. P. Isaac, K. T. Lesko, A. D. Marino, E. B. Norman, C. E. Okada, A. W. P. Poon, A. R. Smith, A. Schülke, R. G. Stokstad. Lawrence Berkeley National Laboratory T. J. Bowles, S. J. Brice, M. Dragowsky, M.M. Fowler, A. Goldschmidt, A. Hamer, A. Hime, K. Kirch, G.G. Miller, J.B. Wilhelmy, J.M. Wouters. Los Alamos National Laboratory E. Bonvin, M.G. Boulay, M. Chen, F.A. Duncan, E.D. Earle, H.C. Evans, G.T. Ewan, R.J. Ford, A.L. Hallin, P.J. Harvey, J.D. Hepburn, C. Jillings, H.W. Lee, J.R. Leslie, H.B. Mak, A.B. McDonald, W. McLatchie, B. Moffat, B.C. Robertson, P. Skensved, B. Sur. Queen's University
n Reactions in SNO n + Þ + + - CC d p p e e • Good measurement of ne energy spectrum • Weak directional sensitivity1-1/3cos(q) • ne only. n + Þ + + n NC d p n x x • Measure total 8B n flux from the sun. • Equal cross section for all n types ES - - + Þ + ν e ν e x x • Low Statistics • All n types but enhanced sensitivity to ne • Strong directional sensitivity
Signals in SNO NC Salt (BP98)
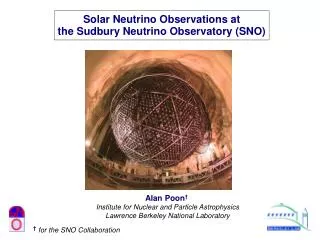
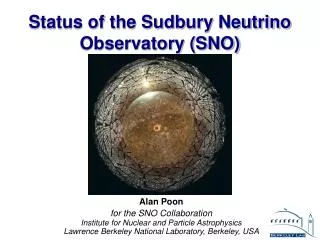
The SNO Detector 1000 tonnes D2O Support Structure for 9500 PMTs, 60% coverage 12 m Diameter Acrylic Vessel 1700 tonnes Inner Shielding H2O 5300 tonnes Outer Shield H2O Urylon Liner and Radon Seal
Signals in SNO ES CC Charged-current spectrum is more sensitive to shape distortions!
Signals in SNO Charged-Current to Neutral Current ratio is a direct signature for oscillations No oscillations MSW oscillations SNO’s Anticipated CC/NC Sensitivity
Signals in SNO 0.154 CC/ES Could also show significant effects! Bahcall et al.
SNO Calibrations Electronics Calibration Electronic pulsers Optical Calibration Pulsed laser ~2ns (337, 365, 386, 420, 500 and 620 nm) Attenuation, Reflection, Scattering, Relative QE Energy Calibration • 16N 6.13 MeV ’s • p,T 19.8 MeV ’s • neutrons 6.25 MeV ’s • 8Li spectrum endpoint Low Energy Backgrounds Encapsulated Th and U sources
SNO Energy Calibrations 252Cf neutrons b’s from 8Li g’s from 16N and t(p,g)4He
SNO Event Reconstruction Reconstruction position of 8Li events Reconstruction Resolution