Data Processing for the Sudbury Neutrino Observatory
180 likes | 350 Vues
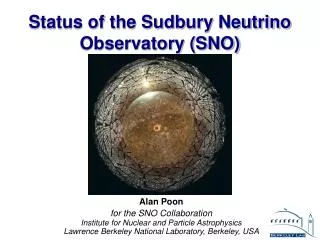
Data Processing for the Sudbury Neutrino Observatory . Aksel Hallin Queen’s, October 2006. Sudbury Neutrino Observatory. Support Structure for 9500 PMTs, 60% coverage. 12 m Diameter Acrylic Vessel. 1700 tonnes Inner Shielding H 2 O. 5300 tonnes Outer Shield H 2 O. Urylon Liner and

Data Processing for the Sudbury Neutrino Observatory
E N D
Presentation Transcript
Data Processing for the Sudbury Neutrino Observatory Aksel Hallin Queen’s, October 2006
Sudbury Neutrino Observatory Support Structure for 9500 PMTs, 60% coverage 12 m Diameter Acrylic Vessel 1700 tonnes Inner Shielding H2O 5300 tonnes Outer Shield H2O Urylon Liner and Radon Seal 1000 tonnes D2O ($300 M)
Unique Signatures in SNO (D2O) Charged-Current (CC) e+d e-+p+p Ethresh = 1.4 MeV eonly Neutral-Current (NC) x+d x+n+p Ethresh = 2.2 MeV Equally sensitive to e nmt 3 ways to detect neutrons Elastic Scattering (ES) x+e- x+e- x, but enhanced fore
Numerical tools for SNO • “Data Cleaning” • Monte Carlo • “Fitters” • “Physics Interpretation”
Reconstruction Signal Extraction Physics interpretation
Observables Photomultiplier tube • position • time • charge Reconstructed event • vertex • direction • energy • isotropy
“Data Cleaning” • TABLE II: Number of events remaining in data set after each • step in the data processing described in Section 5. • . • Data Processing Step Events Remaining • Total event triggers 450188649 • Neutrino triggers (hit multiplicity) 191312560 • Analysis Nhit cut (Nhit > 21) 10088842 • Low-level cuts 7805238 • `Cherenkov Box' cuts 3418439 • Fiducial volume cut 67343 • Energy threshold (Te > 5 MeV) 3440 • Muon follower cut 2981 • Atmospheric followers 2928 • Total candidates 2928
Assumption: No 8B shape distortion OR Extracting the Solar n Flux CC NC ES • PDFs: kinetic energyT, event location R3, solar angle correlation cosqsun Maximum Likelihood Fit 8Bn shape constrained fit: [in 106 cm-2 s-1] No 8Bn shape constraint:
35Cl+n 2H+n 8.6 MeV 6.25 MeV 3H 36Cl 3 Phases of SNO: neutron (NC) detectionmethods (systematically different) Phase I (D2O) Nov. 99 - May 01 Phase II (salt) July 01 - Sep. 03 Phase III (3He) Nov. 04-Dec. 06 n captures on 2H(n, g)3H Effc. ~14.4% NC and CC separation by energy, radial, and directional distributions 2 t NaCl. n captures on 35Cl(n, g)36Cl Effc. ~40% NC and CC separation by event isotropy 40 proportional counters 3He(n, p)3H Effc. ~ 30% capture Measure NC rate with entirely different detection system. 5 cm n 3H p 3He n + 3He p + 3H
What does it mean to calibrate? • Determine unknown parameters in the Monte Carlo. In SNO, these are almost all optical constants. • Measure how well we reconstruct position, direction, energy, isotropy as a function of position in the detector and calendar time. In SNO, the calibration effort dominates the analysis. Typically 90% of the analysis effort is used to calibrate, measure backgrounds, and understand systematics; the signal extraction is quite standard. Improvements in the analysis come about because of improved calibration.
Dec 1/05 Sep 1/05 Dec 1/05 Mar 1/05 Jun 1/05 Phase III Livetime: Nov 27, 2004 to Nov 28, 2005 SNO Detector Livetime RUN TYPE # OF DAYS PERCENTAGE ======================================== NEUTRINO 249.58 68.19 SUPERNOVA 0.14 0.04 CALIBRATION 89.26 24.39 OTHER 14.47 3.95 NO RUN 12.55 3.43
Calibration SourceManipulator Umbilicals Manipulation Detector Interface Radon/Light Barrier Accuracy < 2 cm single axis ~ 5 cm triple axis Remote Operation/Interlocks Stringent Cleanliness Requirements
337,365,386,420,500,620 nm wavelengths 45 Hz Pulse rate Intensity dynamic range about 1e7 600 ps pulse width
Optical Analysis Number of in-time hits in run i and pmt j = (Number of photons emitted in run i) x (solid angle of pmt j and run i) x (pmt angular response) x (transmssion through acrylic) x (laserball intensity distribution) x (efficiency of pmt j) x (transmission through water and acrylic) Remove unknown individual PMT efficiencies with “occratio” Typically 40 runs x 7000 pmts = 280,000 data points Fit for about 400 parameters:
OpticalAnalysis D2O Attenuation H2O Attenuation PMTcalibrations, PMTangularresponse, lD20, lacrylic,lH2O