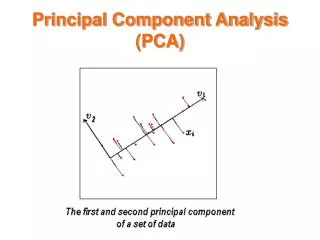
PCA Principal Component Analysis
PCA Principal Component Analysis. Sensor 3. Sensor 4. x = 1.8196 5.6843 6.8238 4.7767 1.0397 4.1195 6.0911 4.2638 1.1126 4.6507 7.8633 5.5043 1.3735 6.0801 8.0462 5.6324 2.4124 3.6608 7.1652 5.0156

PCA Principal Component Analysis
E N D
Presentation Transcript
PCA Principal Component Analysis
Sensor 3 Sensor 4 x = 1.8196 5.6843 6.8238 4.7767 1.0397 4.1195 6.0911 4.2638 1.1126 4.6507 7.8633 5.5043 1.3735 6.0801 8.0462 5.6324 2.4124 3.6608 7.1652 5.0156 3.2898 4.7301 6.0169 4.2119 2.9436 4.2940 7.4612 5.2228 1.6561 3.1509 5.2104 3.6473 0.4757 1.4661 6.6255 4.6379 2.1659 1.6211 9.2418 6.4692 1.4852 3.6537 7.3074 5.1152 0.7544 3.3891 6.1951 4.3365 2.3136 3.5918 7.6207 5.3345 2.4068 2.5844 6.8016 4.7611 2.5996 4.2271 7.7247 5.4073 1.8136 4.2080 6.7446 4.7212 N Medida 9 Medida 14 m
x= 0.5632 0.0525 0.1992 0.9442 -1.4904 0.0169 0.5112 0.2334 2.3856 0.4861 0.5951 0.0604 0.6180 1.5972 -0.5145 -0.6150 1.7430 1.4551 -1.0344 -0.9598 1.5369 1.3969 0.1178 -0.5428 0.8500 0.9795 -1.4907 -0.7346 -0.0970 -0.7409 -0.9971 -0.8030 -0.1868 -0.2996 -0.5746 -0.8211 1.2367 2.3720 0.3793 0.1620 0.0675 -0.3321 1.3183 0.7651 -0.8986 -0.5059 -0.1140 1.3910 -0.6703 0.1073 2.3948 1.4875 1.0090 1.2579 0.0914 -0.3765 -0.1388 -0.7678 -2.3396 -1.2983 0.9069 1.4772 -0.3849 -0.0941 -0.3874 -0.4512 0.0444 -0.1314 -0.2293 -0.6040 0.4161 0.5944 -3.0050 -1.9646 -1.1580 -0.1741 -0.6379 -1.7942 1.0003 -0.4333 0.2530 -0.1742 1.8173 1.5607 -1.7688 -2.0968 0.1575 -0.1781 -0.5782 0.0264 -2.5254 -1.8191 0.5193 0.9366 1.7935 1.6216 -1.7429 -1.9603 0.4392 -0.3092]
clear all; N=50; sigma2=[1 0.8 ; 0.8 1]; mi=repmat([0 0],N,1); xx=mvnrnd(mi,sigma2); xmean=mean(xx,1); [lin,col]=size(xx); x=xx-repmat(xmean,lin,1); [p,lat,exp]=pcacov(x); plot(x(:,1),x(:,2),'+'); hold on plot([p(1,1) 0 p(1,2)],[p(2,1) 0 p(2,2)])
cov = [1 0 ; 0 1] cov=[1 0.9 ; 0.9 1]
cov = [1 0 ; 0 1] cov=[1 0.9 ; 0.9 1]
cov = [1 0 ; 0 1] cov=[1 0.9 ; 0.9 1]
Para Gaussianas: Não Correlacionados Independentes Matriz de Covariança Diagonal cov = [1 0 ; 0 1]
Dado XNm Obter P, tal que Y = XP é diagonal. No caso de e-valores distintos: P-1 A P = L Dada uma matriz Amm , os auto-valores e os auto-vetores v são caracterizados por ou seja, Como (s) é um polinômio de grau m, (s) =0 possui m raízes, 1, 2, ... , m associados a v1, v2, ... , vm
Dado XNm Obter P, tal que Y = XP vj T PTP = vi i = j A = XTX P-1 A P = L é diagonal. vi e-vetores de XTX ( normalizados vi = 1) P é simétrica P-1 = PT
Dado XNm Obter P, tal que Y = XP vj T PTP = vi é diagonal. PT = P i j A = XTX P-1 A P = L vi e-vetores de XTX ( normalizados vi = 1) P é simétrica P-1 = PT
Dado XNm Obter P, tal que Y = XP vj T PTP = vi é diagonal. A = XTX P-1 A P = L vi e-vetores de XTX ( normalizados vi = 1) PTP = I P é simétrica P-1 = PT
Dado XNm Obter P, tal que Y = XP é diagonal. A = XTX P-1 A P = L vi e-vetores de XTX ( normalizados vi = 1) P é simétrica P-1 = PT P é ortogonal
Singular Value Decomposition Dado XNm Obter P, tal que Y = XP é diagonal.
Dado XNm Obter P, tal que Y = XP é diagonal. P = Matriz de e-vec de (XTX) V = Matriz à direita no SVD
x= 0.5632 0.0525 0.1992 0.9442 -1.4904 0.0169 0.5112 0.2334 2.3856 0.4861 0.5951 0.0604 0.6180 1.5972 -0.5145 -0.6150 1.7430 1.4551 -1.0344 -0.9598 1.5369 1.3969 0.1178 -0.5428 0.8500 0.9795 -1.4907 -0.7346 -0.0970 -0.7409 -0.9971 -0.8030 -0.1868 -0.2996 -0.5746 -0.8211 1.2367 2.3720 0.3793 0.1620 0.0675 -0.3321 1.3183 0.7651 -0.8986 -0.5059 -0.1140 1.3910 -0.6703 0.1073 2.3948 1.4875 1.0090 1.2579 0.0914 -0.3765 -0.1388 -0.7678 -2.3396 -1.2983 0.9069 1.4772 -0.3849 -0.0941 -0.3874 -0.4512 0.0444 -0.1314 -0.2293 -0.6040 0.4161 0.5944 -3.0050 -1.9646 -1.1580 -0.1741 -0.6379 -1.7942 1.0003 -0.4333 0.2530 -0.1742 1.8173 1.5607 -1.7688 -2.0968 0.1575 -0.1781 -0.5782 0.0264 -2.5254 -1.8191 0.5193 0.9366 1.7935 1.6216 -1.7429 -1.9603 0.4392 -0.3092]
>> [P, Lambda]=eig(xx) P = -0.7563 0.6543 -0.6543 -0.7563 Lambda = 113.9223 0 0 12.1205 >> Lambda = inv(P)*xx*P OK Lambda = 113.9223 0 0.0000 12.1205 Lambda (1) >> Lambda (2) x= 0.5632 0.0525 0.1992 0.9442 -1.4904 0.0169 0.5112 0.2334 2.3856 0.4861 0.5951 0.0604 0.6180 1.5972 -0.5145 -0.6150 1.7430 1.4551 -1.0344 -0.9598 1.5369 1.3969 0.1178 -0.5428 0.8500 0.9795 -1.4907 -0.7346 -0.0970 -0.7409 -0.9971 -0.8030 -0.1868 -0.2996 -0.5746 -0.8211 1.2367 2.3720 0.3793 0.1620 0.0675 -0.3321 1.3183 0.7651 -0.8986 -0.5059 -0.1140 1.3910 -0.6703 0.1073 2.3948 1.4875 1.0090 1.2579 0.0914 -0.3765 -0.1388 -0.7678 -2.3396 -1.2983 0.9069 1.4772 -0.3849 -0.0941 -0.3874 -0.4512 0.0444 -0.1314 -0.2293 -0.6040 0.4161 0.5944 -3.0050 -1.9646 -1.1580 -0.1741 -0.6379 -1.7942 1.0003 -0.4333 0.2530 -0.1742 1.8173 1.5607 -1.7688 -2.0968 0.1575 -0.1781 -0.5782 0.0264 -2.5254 -1.8191 0.5193 0.9366 1.7935 1.6216 -1.7429 -1.9603 0.4392 -0.3092] xx = 70.3445 50.3713 50.3713 55.6982
P = -0.7563 0.6543 -0.6543 -0.7563 >> xnew = x * P Pelim = -0.7563 0.0 -0.6543 0.0 >> xelim = x * Pelim
Médodo da Diagonalização: P = -0.7563 0.6543 -0.6543 -0.7563 >> xn=x/sqrt(N-1) >> [u,sigma,v]=svd(xn) v = -0.7563 0.6543 -0.6543 -0.7563 Lambda = 113.9223 0 0.0000 12.1205 OK sigma = 1.5248 0 0 0.4973 >> sigmadiag =sqrt(Lambda/(N-1)) sigmadiag = 1.5248 0 0.0000 0.4973 OK x= 0.5632 0.0525 0.1992 0.9442 -1.4904 0.0169 0.5112 0.2334 2.3856 0.4861 0.5951 0.0604 0.6180 1.5972 -0.5145 -0.6150 1.7430 1.4551 -1.0344 -0.9598 1.5369 1.3969 0.1178 -0.5428 0.8500 0.9795 -1.4907 -0.7346 -0.0970 -0.7409 -0.9971 -0.8030 -0.1868 -0.2996 -0.5746 -0.8211 1.2367 2.3720 0.3793 0.1620 0.0675 -0.3321 1.3183 0.7651 -0.8986 -0.5059 -0.1140 1.3910 -0.6703 0.1073 Médodo da SVD 2.3948 1.4875 1.0090 1.2579 0.0914 -0.3765 -0.1388 -0.7678 -2.3396 -1.2983 0.9069 1.4772 -0.3849 -0.0941 -0.3874 -0.4512 0.0444 -0.1314 -0.2293 -0.6040 0.4161 0.5944 -3.0050 -1.9646 -1.1580 -0.1741 -0.6379 -1.7942 1.0003 -0.4333 0.2530 -0.1742 1.8173 1.5607 -1.7688 -2.0968 0.1575 -0.1781 -0.5782 0.0264 -2.5254 -1.8191 0.5193 0.9366 1.7935 1.6216 -1.7429 -1.9603 0.4392 -0.3092] x= 0.5632 0.0525 0.1992 0.9442 .... ....
>> [pc,latent,explained]=pcacov(x) latent = 10.6734 3.4814 pc = -0.7563 0.6543 -0.6543 -0.7563 explained = 75.4046 24.5954 >> help pcacov PCACOV Principal Component Analysis using the covariance matrix. [PC, LATENT, EXPLAINED] = PCACOV(X) takes a the covariance matrix, X, and returns the principal components in PC, the eigenvalues of the covariance matrix of X in LATENT, and the percentage of the total variance in the observations explained by each eigenvector in EXPLAINED.
>> [pc,latent,explained]=pcacov(x) latent = 10.6734 3.4814 pc = -0.7563 0.6543 -0.6543 -0.7563 explained = 75.4046 24.5954 >> help pcacov PCACOV Principal Component Analysis using the covariance matrix. [PC, LATENT, EXPLAINED] = PCACOV(X) takes a the covariance matrix, X, and returns the principal components in PC, the eigenvalues of the covariance matrix of X in LATENT, and the percentage of the total variance in the observations explained by each eigenvector in EXPLAINED. P = -0.7563 0.6543 -0.6543 -0.7563 v = -0.7563 0.6543 -0.6543 -0.7563 OK
>> help pcacov PCACOV Principal Component Analysis using the covariance matrix. [PC, LATENT, EXPLAINED] = PCACOV(X) takes a the covariance matrix, X, and returns the principal components in PC, the eigenvalues of the covariance matrix of X in LATENT, and the percentage of the total variance in the observations explained by each eigenvector in EXPLAINED. >> [pc,latent,explained]=pcacov(x) latent = 10.6734 3.4814 pc = -0.7563 0.6543 -0.6543 -0.7563 explained = 75.4046 24.5954 Lambda = 113.9223 0 0 12.1205 sqrlamb = 10.6734 0 0 3.4814 >> sqrlamb=sqrt(evalor)
>> help pcacov PCACOV Principal Component Analysis using the covariance matrix. [PC, LATENT, EXPLAINED] = PCACOV(X) takes a the covariance matrix, X, and returns the principal components in PC, the eigenvalues of the covariance matrix of X in LATENT, and the percentage of the total variance in the observations explained by each eigenvector in EXPLAINED. >> [pc,latent,explained]=pcacov(x) latent = 10.6734 3.4814 pc = -0.7563 0.6543 -0.6543 -0.7563 explained = 75.4046 24.5954 sqrlamb = 10.6734 0 0 3.4814 percent = 75.4046 24.5954 >> e=[Lambda(1,1) ; Lambda(2,2)] >> soma=sum(e) >> percent=e*100/soma
>> [pc,score,latent1,tsquare]=princomp(x) score = -0.4603 0.3288 -0.7684 -0.5837 1.1161 -0.9879 -0.5393 0.1579 -2.1222 1.1932 -0.4896 0.3437 ..... ..... pc = -0.7563 0.6543 -0.6543 -0.7563 latent1 = 2.3249 0.2474 tsquare = 0.5281 1.6315 4.4813 0.2260 7.6929 0.5806 ..... >> help princomp PRINCOMP Principal Component Analysis (centered and scaled data). [PC, SCORE, LATENT, TSQUARE] = PRINCOMP(X) takes a data matrix X and returns the principal components in PC, the so-called Z-scores in SCORES, the eigenvalues of the covariance matrix of X in LATENT, and Hotelling's T-squared statistic for each data point in TSQUARE.
>> help princomp PRINCOMP Principal Component Analysis (centered and scaled data). [PC, SCORE, LATENT, TSQUARE] = PRINCOMP(X) takes a data matrix X and returns the principal components in PC, the so-called Z-scores in SCORES, the eigenvalues of the covariance matrix of X in LATENT, and Hotelling's T-squared statistic for each data point in TSQUARE. >> [pc,score,latent1,tsquare]=princomp(x) score = -0.4603 0.3288 -0.7684 -0.5837 1.1161 -0.9879 -0.5393 0.1579 -2.1222 1.1932 -0.4896 0.3437 ..... ..... pc = -0.7563 0.6543 -0.6543 -0.7563 latent1 = 2.3249 0.2474 tsquare = 0.5281 1.6315 4.4813 0.2260 7.6929 0.5806 ..... P = -0.7563 0.6543 -0.6543 -0.7563
>> help princomp PRINCOMP Principal Component Analysis (centered and scaled data). [PC, SCORE, LATENT, TSQUARE] = PRINCOMP(X) takes a data matrix X and returns the principal components in PC, the so-called Z-scores in SCORES, the eigenvalues of the covariance matrix of X in LATENT, and Hotelling's T-squared statistic for each data point in TSQUARE. >> [pc,score,latent1,tsquare]=princomp(x) score = -0.4603 0.3288 -0.7684 -0.5837 1.1161 -0.9879 -0.5393 0.1579 -2.1222 1.1932 -0.4896 0.3437 ..... ..... sco = -0.4603 0.3288 -0.7684 -0.5838 1.1161 -0.9880 -0.5393 0.1580 -2.1223 1.1933 -0.4896 0.3437 >> sco=x*P
>> help princomp PRINCOMP Principal Component Analysis (centered and scaled data). [PC, SCORE, LATENT, TSQUARE] = PRINCOMP(X) takes a data matrix X and returns the principal components in PC, the so-called Z-scores in SCORES, the eigenvalues of the covariance matrix of X in LATENT, and Hotelling's T-squared statistic for each data point in TSQUARE. >> [pc,score,latent1,tsquare]=princomp(x) score = -0.4603 0.3288 -0.7684 -0.5837 1.1161 -0.9879 -0.5393 0.1579 -2.1222 1.1932 -0.4896 0.3437 ..... ..... pc = -0.7563 0.6543 -0.6543 -0.7563 latent1 = 2.3249 0.2474 tsquare = 0.5281 1.6315 4.4813 0.2260 7.6929 0.5806 ..... >> eig(x'*x/(N-1)) ans = 0.2474 2.3249
caracteriza a região de confiança 100 a% >> help princomp PRINCOMP Principal Component Analysis (centered and scaled data). [PC, SCORE, LATENT, TSQUARE] = PRINCOMP(X) takes a data matrix X and returns the principal components in PC, the so-called Z-scores in SCORES, the eigenvalues of the covariance matrix of X in LATENT, and Hotelling's T-squared statistic for each data point in TSQUARE. >> [pc,score,latent1,tsquare]=princomp(x) score = -0.4603 0.3288 -0.7684 -0.5837 1.1161 -0.9879 -0.5393 0.1579 -2.1222 1.1932 -0.4896 0.3437 ..... ..... pc = -0.7563 0.6543 -0.6543 -0.7563 latent1 = 2.3249 0.2474 tsquare = 0.5281 1.6315 4.4813 0.2260 7.6929 0.5806 .....
>> xm=mean(xx); >> [lin,col]=size(xx); >> xm=repmat(xm,lin,1); >> xx=xx-xm;
x = -0.4326 -1.6656 0.1253 0.2877 -1.1465 1.1909 1.1892 -0.0376 0.3273 0.1746 -0.1867 0.7258 -0.5883 2.1832 -0.1364 0.1139 1.0668 0.0593 -0.0956 -0.8323 N >> [u,sigma,v]=svd(x) sigma = 3.2980 0 0 2.0045 0 0 0 0 0 0 0 0 0 0 0 0 0 0 0 0 u = 0.4460 0.4456 -0.2868 0.4908 0.1650 0.0392 0.1066 -0.0386 0.4553 -0.1743 -0.0726 -0.1012 -0.4848 0.1055 -0.0323 -0.2554 -0.7703 -0.0485 0.0638 0.2687 -0.4458 0.3769 0.6421 0.2784 0.0623 -0.0995 -0.3056 -0.0404 0.2425 0.0424 0.1146 -0.5628 0.1922 0.7577 -0.0733 0.0123 0.0424 0.0239 -0.2207 0.0494 -0.0222 -0.1814 0.0253 -0.0595 0.9785 -0.0107 -0.0308 0.0038 -0.0560 0.0280 -0.2271 -0.0149 -0.1378 0.0660 0.0063 0.9434 -0.1717 -0.0146 0.0532 0.0484 -0.6853 -0.0321 -0.4187 0.2038 0.0205 -0.1705 0.4827 -0.0445 0.1649 0.1443 -0.0450 0.0488 -0.0384 0.0320 0.0076 -0.0097 -0.0300 0.9956 0.0281 0.0029 0.0758 -0.5182 0.1585 -0.2137 -0.0664 0.0039 0.0167 0.0200 0.8044 0.0516 0.2334 0.1651 0.1094 -0.0129 0.0120 0.0625 0.1882 0.0107 -0.0038 0.9309 v = 0.2876 -0.9578 -0.9578 -0.2876 N N