Download
1 / 21
210 likes | 354 Vues
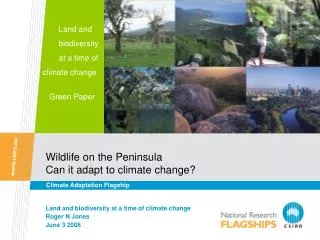
Wildlife on the Peninsula Can it adapt to climate change?. Climate Adaptation Flagship. Land and biodiversity at a time of climate change Roger N Jones June 3 2008. Observed changes in physical and biological systems since 1970. IPCC 2007. Core bioclimatic range loss – warming.

E N D
Wildlife on the Peninsula Can it adapt to climate change? Climate Adaptation Flagship Land and biodiversity at a time of climate change Roger N Jones June 3 2008
Observed changes in physical and biological systems since 1970 IPCC 2007
Impacts with a 1°C warming • 10–40% shrinkage of snow-covered area in the Australian Alps • 18–60% decline in 60-day snow cover in the Australian Alps • Bleaching and damage to the Great Barrier Reef equivalent to 1998 and 2002 in up to 50% of years • 60% of the Great Barrier Reef is regularly bleached • Habitat is lost for 14% of Victoria's marine invertebrates • 50% decrease in habitat for vertebrates in northern Australia tropics • <5% loss of core habitat for Victorian and montane tropical vertebrate species • 28% of Dryandra species’ core habitat is significantly reduced in SW Australia • 4% of 43 Acacia species’ core habitat is significantly reduced in SW Australia • 63% decrease in Golden Bowerbird habitat in N Australia • Habitat for 3 frog and 15 threatened/endangered mammals in W Australia is lost or restricted • 50% decrease in montane tropical rainforest area in N Australia
Impacts with a 2°C warming • Up to 58–81% of the Great Barrier Reef is bleached every year • Hard coral reef communities are widely replaced by algal communities • 90% decrease in core habitat for vertebrates in northern Australia tropics • 5–10% loss of core habitat for Victorian and montane tropical vertebrate species • 88% of butterfly species’ core habitat decreases • 66% of core habitat for Dryandra species is significantly reduced in SW Australia. • All 43 Acacia species tested lose core habitat in SW Australia
Impacts with a 3°C warming • 97% of the Great Barrier Reef is bleached every year • 10–40% loss of core habitat for Victoria and montane tropical vertebrate species • 92% of butterfly species’ core habitat decreases • 98% decrease in Bowerbird habitat in N Australia • Complete loss of freshwater wetlands in Kakadu • 20–85% shrinkage of total snow-covered area in the Australian Alps • 38–96% decline in 60-day snow cover in the Australian Alps
Vulnerability for key sectors IPCC 2007
Ecological themes Climate Primary productivity Hydrology Biophysical habitats Interactions between organisms Movement of organisms Natural disturbance regimes Threats Climate change Nutrient additions Biophysical habitat loss Altered hydrology Invasive species Key processes URBANISATION
Accounting for rate of change • Maximum rate of warming between 2020 and 2060, depends on climate sensitivity and when emissions begin to decline. • Projected rate of warming between 0.2 and 0.7°C per decade • Current rate of warming is ~0.2°C per decade, ~0.4°C per decade possible by 2040 possible even with action to stabilise emissions • Expect at least 0.8°C global mean warming 1990–2030
How fast should they run? Plains • At 0.2°C per decade: 25 to 100 km • At 0.5°C per decade: 60 to 250 km Foothills and central hills • At 0.2°C per decade: 4 to 10 km • At 0.5°C per decade: 10 to 25 km Central highlands • At 0.2°C per decade: 1 to 2 km • At 0.5°C per decade: 3 to 5 km
How fast should they climb? Central highlands • At 0.2°C per decade: 50 to 100 m • At 0.5°C per decade: 125 to 250 m
Climate change is fast but urban growth is faster The Mornington Peninsula would be a natural refuge for species wanting to move south to cooler climates … … but they are likely to be stuck between the devil and the deep blue sea Stuart Roth – Lot’s Wife
Peri-urban fire risk • Too little land to support a mosaic of fire regimes: • Grasslands need more frequent burns • Wet forests need less frequent burns
Understanding and managing change • Acclimatisation Change in behaviour Change in genetic mix of population • Adaptation (evolutionary) Change in underlying genetic base Selection of “rare” or newly arising genetic types • Adaptation (Social) Change in planning and management Wider recognition of environmental values Increased recognition of natural capital in social and economic fabric
What are natural assets? Human resources Ecosystem processes (Natural Capital) Market forces Government funding
Link our natural assets to change processes • Fire – land condition, species succession, weed and pest recruitment • Drought – vegetation condition, population numbers, fire risk, land management during times of stress • Flood and heavy rain – plant and animal breeding, weed and pest recruitment • Monitoring land and habitat condition and change processes • Urgent need to understand link between human resources, market forces and public funding
Immediate actions • Identify shared risks (e.g. between climate, fragmentation, hydrology, invasives) • Expert mapping of change pressures on large systems • Active monitoring testing and observing change processes • Large scale revegetation (e.g. direct seeding) recognising pressures at the patch/landscape scale • Change from conservation to stewardship model • Significant new investment in knowledge and management • Invest in biodiversity in a planned manner rather than throw money at it during successive episodes of pork barrelling
Change and transform Biodiversity sequestration • Carbon will have a value • Some of the drivers of higher carbon values will be negative, some positive for biodiversity • Invest in standing carbon where biodiversity is a shared value (e.g. box-ironbark forests, wetlands, riparian zones) • Invest every dollar twice (e.g. the same dollar will give double returns on carbon + more resilient ecosystems)
CSIRO Marine and Atmospheric Research Dr Roger N Jones Principal Research Scientist Phone: +61 3 9239 4555 Email: roger.jones@csiro.au Thank you Contact UsPhone: 1300 363 400 or +61 3 9545 2176Email: Enquiries@csiro.au Web: www.csiro.au