Download
1 / 1
10 likes | 182 Vues
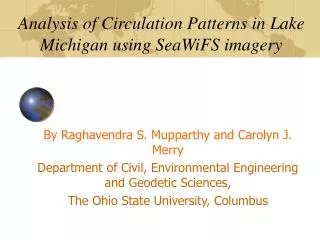
Satellite data. In situ optical Data. Atmospheric correction using SeaDAS. Processing to obtain binned data sets. Data product generation. Propagate data to surface. Data product generation. In situ water quality data (ground truth). Comparison.

E N D
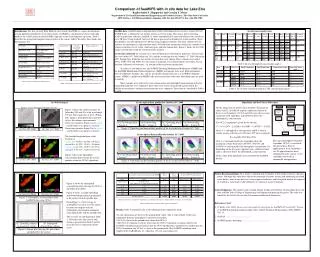
Satellite data In situ optical Data Atmospheric correction using SeaDAS. Processing to obtain binned data sets Data product generation Propagate data to surface Data product generation In situ water quality data (ground truth) Comparison Comparison of SeaWiFS with in situ data for Lake Erie Raghavendra S. Mupparthy and Carolyn J. Merry Department of Civil and Environmental Engineering and Geodetic Science, The Ohio State University, 2070 Neil Ave., 470 Hitchcock Hall, Columbus, OH Tel: 614-292-2771, Fax: 614-292-3780 Introduction: The Sea-viewing Wide Field-of-view Sensor (SeaWiFS) is a space-based remote sensing platform intended for ocean observations. SeaWiFS is a multispectral sensor with eight bands in the visible and near infrared (NIR) segments of the electromagnetic spectrum. Table 1 describes the spatial and temporal characteristics of the sensor. Table 2 describes these bands and their primary use. Satellite data: SeaWiFS data is obtained from NASA’s Distributed Active Archive Center (DAAC). SeaWiFS data is obtained in raw format, known as level-1A data. This data is processed using NASA’s proprietary software, SeaDAS, to obtain atmospherically-corrected radiance data, known as level-1B data. Using SeaDAS, the level-1B data is processed to obtain level-2 data products. These data products are derived from level-1B data using empirical relations. The most common level-2 products are chlorophyll_a concentration and k_490 (diffusion attenuation coefficient). Another level of processed data is level-3 data, which are space and time-binned data. Figure 1 shows the level-1B images for both dates with the station locations marked. In situ data collection: In situ data were collected during two field trips to Lake Erie. The first trip was on October 19th, 2000 (Julian day 293) and the second trip was on October 31st, 2000 (Julian day 305). During these field trips two stations for each date were chosen. These stations were called 293A, 293B, 305C and 305D. At each station, a minimum of six measurements were taken. The in situ data collected is of two types – in situ optical data and water quality data. To collect in situ optical data, the SeaWiFS Profiling Multichannel Radiometer (SPMR) and the SeaWiFS Multichannel Surface Reference (SMSR) instruments were used. Both instruments were developed by Satlantic, Inc. and are specifically designed for use as a SeaWiFS validation system. SPMR is a profiler and SMSR is the reference for data collection, when both units are used in tandem. Water samples were collected at each station and in situ chlorophyll concentration and total suspended sediments were computed. These data were used as ground truth against which the satellite measurements and optical measurements were compared. These data are tabulated in Tables 3 and 4. In situ water quality data Table 3: In situ chlorophyll concentration (μg/L) Table 1: Sensor and mission characteristics Table 2: Description of the spectral bands and their primary use Table 4: In situ total suspended sediment, TSS concentration (mg/L) SeaWiFS Imagery In situ optical data profiles for October 19th, 2000 Algorithms and the Process Flowchart Figure 1: Level–1B data(wavelength: 555 nm) All the image data are processed in SeaDAS. The program called ‘msl12’ in SeaDAS employs empirical relations to derive level 2 products. OC2v2 and OC4v4 are the two most commonly used algorithms in SeaDAS to derive the chlorophyll_a concentration. The OC2v2 algorithm is given by the relation: C = 10^(0.2974 –2.2429R + 0.8358R2 – 0.0077R3) – 0.0929 where C = chlorophyll_a concentration, and R is ratio of remote sensing reflectance at 490 nm to 555 nm wavelength. R = log((Rrs-490)/(Rrs-555)) OC4 is a 'maximum band ratio' algorithm where the maximum of three band ratios (443/555, 490/555, and 510/555) is used to predict the chlorophyll concentration. So depending on the first-guess pigment ratio, a different band ratio is chosen to derive the chlorophyll_a concentration. In this study, both algorithms were used with the SeaWiFS dataset. Figure 1 shows the satellite imagery for Julian day 293 and 305 at the wavelength 555 nm. This image data is level-1B data. This image is atmospherically corrected to give the radiance measurements. Green cross-point in Figure 1(a) is station A and the blue cross-point is station B. Green cross-point in Figure 2(a) is station C and the blue cross-point is station D. The latitude/longitude/depth at the location of: station A is 41.661 / -82.492 / 14.03 m; station B is 41.527 / -82.411 / 14.64 m; station C is 41.774 / -82.971 / 10.37 m; station D is 41.615 / -82.815 / 18.30 m; Figure 2 shows the chlorophyll concentration derived from the level-2 product (using the OC2v2 algorithm). In situ optical data profiles for October 31st, 2000 Figure 2: Level–2 data (Chlorophyll_a concentration) The same chlorophyll estimation algorithm, OC2v2, is used with the optical data. Prior to application of these algorithms, the 3D optical data has been interpolated to the surface, so the algorithms can result in meaningful interpretations. • Future Recommendations: This study is confined only to shallow waters with just four in situ data points. Although this study does indicate the potential of remote sensing and monitoring of inland water bodies, more in situ data sets, better empirical relations, and bio-optical models are required to establish a statistically viable alternative to expensive in situ techniques. • Acknowledgments: The authors wish to thank George Leshkevich (NOAA) for providing the in situ data and Dan Vehr (College of Engineering) for helping with printing this poster. The study was funded by the NOAA Great Lakes Environmental Research Laboratory. • References Cited: • O’Reilly et al., 2000. Ocean color chlorophyll a algorithms for SeaWiFS OC2 and OC4: Version 4, SeaWiFS postlaunch technical report series, NASA Technical Memorandum, 2000-206892, Vol. 11. • SeaDAS - http://seadas.gsfc.nasa.gov • SeaWiFS project homepage - http://seawifs.gsfc.nasa.gov/ Figure 5 shows the chlorophyll concentration derived using the OC4v4 algorithm in SeaDAS. Figure 6 shows a sample upwelling and downwelling radiance propagated to the surface from the profile data. From Figure 5, a 3X3 average of chlorophyll was taken over the station locations to compare with the chlorophyll concentration computed using optical data and the ground truth. These results are summarized in Table 5. (Note that only one cast for each station is presented in Table 5 and the mean has been evaluated for all the casts.) * Distance measure is computed as sqrt(sum(x-xi)2); Distance measure is a rough estimate of distance to ground truth. Table 5: Final results comparing chlorophyll concentration • Results: Table 5 summarizes the results obtained in the comparison study. • In situ optical data are closer to the ground truth values. This is expected due to the noise contributed from the atmosphere to remotely sensed data. • OC2v2 is closer to the ground truth values than OC4v4. • The OC4v4 estimation is always lower than the OC2v2 estimation. A similar study by the SeaWiFS validation team [1] indicate that the OC4v4 prediction is quantitatively smaller than the OC2v2 estimation, but OC4v4 is closer to the ground truth. The SeaWiFS validation study employed the SeaBAM data set, which has very few coastal data sets.