Sustainable Systems in Environmental Science
Explore the concepts of sustainability, population growth, and economic development in environmental science. Learn about ecosystems, exponential vs. linear growth, and the implications of economic growth on the environment. Discover the challenges and opportunities for environmentally sustainable development.


Sustainable Systems in Environmental Science
E N D
Presentation Transcript
APES Ch.1 Notes Mrs. Sandefur
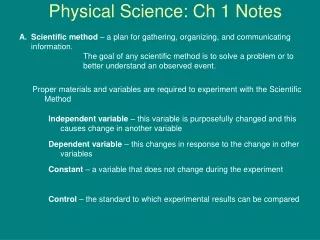
The Study of Environmental Science Ecosystem: a particular location whose interacting components include living (biotic) and non living (abiotic) components Environmental Science study of ecosystems (ecology) Environmentalism social movement that seeks to protect the environment
one that survives over some specified time that attains its full expected life span • a sustainable society manages it’s economy and population size without exceeding the planet’s ability to absorb environmental insults, replenish its resources and sustain life What is a sustainable system?
Easter Island Treeless volcanic island 2200 miles off the coast of Chili Moai -Stone Statues that line the perimeter of the island (250) 13 ft high and 14 tons.
Easter Island Story First inhabitants arrived at Easter Island as early as 318AD. Most believe they were Polynesian, however, some think they arrived from South America. Between 1400-1600, population was around 9,000.
In 1772, the first European visitors arrived on Easter Island. It was deserted! Barren! • There were signs of deforestation, soil depletion and erosion. • Most archeologist believe the natives cleared the trees for crop land. Planted crops stripped nutrients from the soil. • Clear signs of cannibalism. The Easter Island story
Do Not eat the goose that lays the golden egg • If you have one million in the bank at 10% interest, you earn $100,000 year. If you spend just $110,000 per year you will be bankrupt in 18 years • Natural cycles will provide for us if we do not destroy our natural capital LIVING OFF EARTH’S CAPITAL Don’t Eat me
Population and Economic growth Linear growth vs.exponential growth • linear growth: quantity increases by a fixed amount. EX. 1,2,3,4 • Exponential growth: quantity increases by a fixed % of the whole in a given time. EX: 2,4,8,16,32
Human Population Growth World total • Population is growing exponentially at a worldwide rate of 1.2%. In developing countries it is 1.7%. In developed countries it is .1%. • 226,000 more people per day world Developing countries 10 9 8 developing 7 6 5 Developed countries 4 3 developed 2 1 2000 2050 2100 1950 Fig. 1.1, p. 2
16 15 ? 14 13 12 11 ? 10 9 Billions of people 8 ? 7 6 5 4 3 2 Black Death–the Plague 1 0 2-5 million years 8000 6000 4000 2000 2000 2100 Time B.C. A.D. Fig. 1.1, p. 2 Hunting and gathering Agricultural revolution Industrial revolution
70 doubling % growth rate time in years Rule of 70 World Population Growth Rate 70 51.8 years 1.35 %
An increase in the capacity to provide goods and services for people’s final use • economic growth is measured by an increase in GNP. • GNP: gross national product: $ value of goods and services produced by a country’s businesses within and outside the country • GDP: gross domestic product: $ value of goods and services produced within the country • GWP: gross world product: total $ value of goods and services produced in the world • The problem with GNP is the higher the GNP the more resource depletion and environmental damage. GNP is not the best indicator of quality of life. • per capita GNP: individuals slice of the economic pie Economic growth
Economic development • countries are classified as either developing or developed based on their per capita GNP and their level of industrialization • developed countries: U.S., Canada, Japan, Australia, New Zealand, and all of Europe. • per capita GNP greater than $10,000 • generate 75% of pollution • use 88% of resources • have 85% of wealth • make up 20% of population
80% of population • some are middle income $1,000 to $10,000 per capita GNP • like South Africa, Mexico, Brazil, Malaysia • some are low income with a per capita GNP of less than 1,000 like India, Pakistan, China • 95% of population growth will take place in developing countries Developing: Africa, Asia, Latin America
Environmentally Sustainable Development • economic growth has allowed us to • Live longer • be healthier • have more comfort • It has not allowed us to • stop environmental problems • Wipe out poverty
encourages sustainable forms of economic growth that meets the basic needs of the current generations of humans without preventing future generations and other species from meeting their basic needs • discourages environmentally harmful and unsustainable forms of economic growth • it requires that governments, businesses and individuals integrate environmental goals into their decision making process Environmentally sustainable development:
The Wealth Gap • the gap between per capita GNP or the rich and poor has greatly widened since 1980. • 20% high income, 25% moderate income, 30% low income $2-3 / day, 25% very low income of less than $1.00/day. • 1 in 5 is hungry, malnourished, lacks access to clean water, decent housing and health care.
Globalization is the broad process of global, social, economic and environmental change that leads to an increasingly integrated world. • A few indicators of globalization: • global economy grew from 6.7 trillion to $42 trillion since 1950 Globalization
anything that we get from the environment to meet our needs and desires • perpetual resource: something that is continually renewed like solar energy • renewable: On a human time scale something that can be renewed fairly rapidly (Within decades) What is a resource
biodiversity: variety of life forms that can survive a variety of conditions • Genetic diversity • species diversity • ecological diversity • provides free recycling, purification, resources and pest control Biodiversity
renewable resources can be depleted • SUSTAINABLE YIELD: highest rate at which a renewable resource can be used without reducing its available supply • Tragedy of The Commons by “Garrett Hardin”: Overuse of common property resources, which are owned by no one but available to everyone free of charge. For example clean air, oceans, fish, Antarctica. This leads to exploitation then no one can use the resource. “ If I don’t use this resource then someone else will, the little bit I pollute is not enough to matter” Sustainable Yield
Resources Perpetual Nonrenewable Non- metallic minerals Metallic minerals Fossil fuels Winds, tides, flowing water Direct solar energy (iron, copper, aluminum) (clay, sand, phosphates) Renewable Fresh air Fresh water Fertile soil Plants and animals (biodiversity) Fig. 1.11, p. 11
Environmental Degradation: occurs when the resource’s natural replacement rate is exceeded. The following are examples of degradation - deforestation • water logging or salinization of soil • deforestation • pollution • reduction in biodiversity • groundwater depletion • Wetlands destruction
non-renewable: resources that exist in fixed quantities in the earth’s crust • energy resources like coal, gas, uranium which are burned and lost • metallic mineral resources that can recycled • Non-metallic mineral resources that are difficult to recycle
Any addition to air, water, soil, or food that threatens the health, survival, or activities of humans or other animals. It can be natural or from humans Two types of pollutant sources: • point source: where pollutants come from a single identifiable source, like a drainpipe or a smokestack. • Non-point source: pollutants that come from dispersed sources. Examples are runoff from fertilizers and pesticides or oil from cars. Two approaches to dealing with pollution: • pollution prevention • pollution clean-up What is Pollution
rapid population growth • rapid and wasteful use of resources with little emphasis on pollution prevention • degradation of life support systems • poverty • failure of economic and political systems to have market prices that include environmental costs • Our urge to dominate and manage nature for our use with far too little knowledge of how nature works • Population x Affluence x Technology = Environmental Impact Key Environmental Problems and Their Root Causes
Biodiversity Depletion • Habitat destruction • Habitat degradation • Extinction • Air Pollution • Global climate change • Stratospheric ozone depletion • Urban air pollution • Acid deposition • Outdoor pollutants • Indoor pollutants • Noise • Food Supply Problems • Overgrazing • Farmland loss • and degradation • Wetlands loss • and degradation • Overfishing • Coastal pollution • Soil erosion • Soil salinization • Soil waterlogging • Water shortages • Groundwater depletion • Loss of biodiversity • Poor nutrition Major Environmental Problems • Water Pollution • Sediment • Nutrient overload • Toxic chemicals • Infectious agents • Oxygen depletion • Pesticides • Oil spills • Excess heat • Waste Production • Solid waste • Hazardous waste Fig. 1.13, p. 14
Per Captia Ecological Footprint (Hectares of land per person) Country 10.9 United States 5.9 The Netherlands 1.0 India Fig. 1.10a, p. 11
Total Ecological Footprint (Hectares) Country 3 billion hectares United States 94 million hectares The Netherlands 1 billion hectares India Fig. 1.10b, p. 11
Developing Countries X X = Consumption per person (affluence, A) Technological impact per unit of consumption (T) Environmental impact of population (I) X = X Population (P) X X = Developed Countries Fig. 1.15, p. 15
Who should we believe? • The precautionary principle • Try not to be overwhelmed by the environmental bad news because there is a lot of good environmental news. Environmental Worldviews
“Never doubt that a small group of thoughtful, committed citizens cannot change the world. Indeed, it is the only thing that ever has” Margaret Mead
The Invention that changed everything: The plow Part 2: The History of Environmental Science
Effects of Agricultural Revolution • Birth rates rose faster than death rates and population increased • People cleared increasingly larger plots of land and destroyed more natural habitat • People began accumulating material goods
Industrial Revolution • Began in England in the mid 1700s • Began when England used up all of its forests and substituted coal for wood • Shift from renewable to n on-renewable • This lead to growth in mechanization and factory towns • Fossil fuel powered farm equipment lead to an increased agricultural yield which lead to more people
Environmental Impacts • Reduced infant mortality • Raised life expectancy which lead to more people • Better health • Birth control • Education • Affordable goods • income
Globalization and The Information Revolution • Cultural shift to new technologies such as TV, computers an internet • Hard to know what the impacts will be
Possible Impacts • Help us understand more about the Earth and how systems work • Allow us to respond to problems faster • Use technology to monitor changes in the Earth • More sophisticated technology to model complex systems • Technology to reduce pollution and use materials more effectively
Bad Stuff about it • Cause confusion, distraction, and a sense of hopelessness because of information overload • Increase environmental degradation and homogenization of world cultures • We are developing new technologies before we can evaluate their impact
Conservationists1870-1930 • 1870-1900: environmental concern grows because of yellow fever, typhoid fever, cholera, garbage, air pollution, unsafe factories, contaminated water • 1891 Forest Reserve Act: established the responsibilty of the federal government to protec public lands • 1892: John Muir formed the Sierra club
1901-1907: Golden Era of Conservation • Theodore Roosevelt was president • He persuaded congress to give the president the power to designate public land as wildlife refuges • Roosevelt Established the bureau of reclamation • He tripled the size of forest reserves • 1905: Congress created the US Forest service to manage and protect forest reserves. Gifford Pinchot was the first chief • 1912: US National Park System was created by Congress • The passenger pigeon became extinct