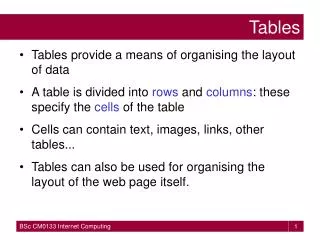
Pivot tables/charts -- Magic Beans Without Living in a Fairy Tale --
Pivot tables/charts -- Magic Beans Without Living in a Fairy Tale --. Prepared by John Van Wagenen for the 34 th Annual International Conference of the Computer Measurement Group, Inc. Las Vegas, Nevada USA Tuesday Dec 9, 2008 9:15 AM. © 2008 John Van Wagenen, Caterpillar Inc.

Pivot tables/charts -- Magic Beans Without Living in a Fairy Tale --
E N D
Presentation Transcript
Pivot tables/charts -- Magic Beans Without Living in a Fairy Tale -- Prepared by John Van Wagenen for the 34th Annual International Conference of the Computer Measurement Group, Inc. Las Vegas, Nevada USA Tuesday Dec 9, 2008 9:15 AM © 2008 John Van Wagenen, Caterpillar Inc. Caterpillar: Confidential Green
When you want to know A NUMERIC VARIABLE BY WITHIN Some Function of Row/Column Row/Column Pivot Tables Answer Questions INTRO Caterpillar: Confidential Green
and now a word from my sponsor Caterpillar is . . . Making Progress Possible • World’s largest manufacturer of construction and mining equipment, diesel and natural gas engines, and industrial gas turbines • #1 or #2 for each industry we serve with a 2010 goal of market leadership for every major product group on every continent • Caterpillar Inc. was established in 1925 with the merger of Holt and Best tractor companies and is located in Peoria Illinois, USA. Global Enterprise Dealer Community Over 96,000 employees Over 100,000 employees Operations in 40 countries Spanning 200 countries INTRO Caterpillar: Confidential Green
The Power Behind the Progress: Information Technology With Vision 2020, Caterpillar has provided clarity of direction regarding the future of the business. It outlines what businesses we want to be in, the values we want to display, the strategic goals that will measure progress, and the critical success factors which we must focus on to realize the vision. INTRO Caterpillar: Confidential Green
Caterpillar CEO Systems & Processes CIO DEPT Technical Infrastructure DIV Computing & Storage Services TEAM Mainframe Capacity & Performance ME “Out-of-Standard” Process Technical Infrastructure – Computing & Storage Services Everyday, more than 10,000 IT professionals around the world are working to enable Caterpillar’s business and success. ~ $80,000 / minute Our Primary CSF Dependability Relentless execution INTRO Caterpillar: Confidential Green
Speaking Points & Demonstration • The data model • Using auto filter • Creating a pivot table • Demo • Creating a pivot table chart • How to categorize/sub-categorize • Chart tricks & making data look good • Demo Caterpillar: Confidential Green
The data model 1st put in labels on the top of the data (line 1) Caterpillar: Confidential Green
Using auto filter • HI-LITE columns 2) Select the DATA dropdown 3) Click FILTER, then click AutoFilter 4) These arrows will appear Caterpillar: Confidential Green
Creating a pivot table (1) Caterpillar: Confidential Green
Creating a pivot table (2) Caterpillar: Confidential Green
Creating a pivot table (3) Caterpillar: Confidential Green
The resulting pivot table Note the toolbar Caterpillar: Confidential Green
DEMONSTRATION OF ACTUAL PIVOT TABLES With CPU Performance Data Caterpillar: Confidential Green
Creating a pivot table chart Caterpillar: Confidential Green
Another way to make a chart Click the Chart icon On the toolbar Caterpillar: Confidential Green
The resulting pivot chart Note the toolbar Caterpillar: Confidential Green
How to make the data look goodFORMAT CELLS & FIELD SETTINGS If you right click on a field tab, the popup box below appears Caterpillar: Confidential Green
How to sub-select data When you click the dropdown arrow next to a field in a pivot table or chart, one of two types of selection lists will appear. on the left, all or any one of the values can be selected. On the right, groups of related items can be selected with checkmarks. Caterpillar: Confidential Green
How to use a Pivot Table Categorize/ Sub-categorize Drilldown Double click a cell in a pivot table (like the hi-lited cell above) And a new worksheet with just the data that made up the cell will be built. Caterpillar: Confidential Green
Chart tricks SAME DATA MANY CHARTS Caterpillar: Confidential Green
DEMONSTRATION OF ACTUAL PIVOT TABLES Charts & Table Formatting Caterpillar: Confidential Green
Thank You Any Questions ??? CAT, CATERPILLAR, their respective logos, “Caterpillar Yellow” and the POWER EDGE trade dress, as well as corporate and product identity used herein, are trademarks of Caterpillar and may not be used without permission. © 2008 John Van Wagenen, Caterpillar Inc. Caterpillar: Confidential Green