Download
1 / 23
250 likes | 415 Vues
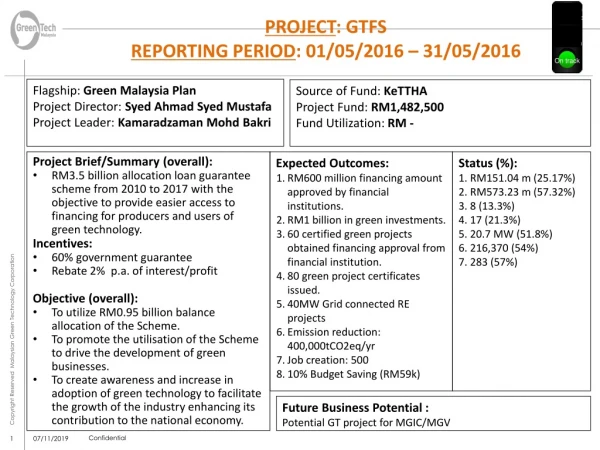
General Transit Feed Specification (GTFS)-based GIS Tool for Creating Practical Applications. East-West Gateway Council of Governments Sang Gu Lee GIS in Transit Conference October 16, 2013 │ Washington, DC. Introduction.

E N D
General Transit Feed Specification (GTFS)-based GIS Tool for Creating Practical Applications East-West Gateway Council of Governments Sang Gu Lee GIS in Transit Conference October 16, 2013 │ Washington, DC
Introduction • Propose use of Google’s General Transit Feed Specification (GTFS) for a transit stop aggregation model (SAM) • The idea of using GTFS has been drawing attention in the public transit planning area these days • One area in which GTFS can be very useful is in developing and updating transit networks used in service planning • We explore how to use this innovative data source in various areas by proposing a SAM
General Transit Feed Specification (GTFS) • Open data format for transit schedules • First released with TriMet (Portland, OR) in 2005 • Incorporating transit information in the Google Maps application • A de facto standard for data describing transit stops, schedules, and route geometry, … • Currently, many transit agencies in the US have made their GTFS data publicly available, which helps developers and transit agencies efficiently share and retrieve GTFS data (e.g., http://www.gtfs-data-exchange.com)
Previous Research • Stop-level boarding and alighting counts aggregated to the segment level for generating a transit route origin-destination matrix (Furth and Navick, 1992) • The need for relevant stop aggregation was discussed to match the scheduled time between bus stops from the transaction data collected (Barry et al. 2002) • Each pair of stops on the opposite sides of a road at the same general location might be combined for predicting transit-related activities (Chu, 2004)
Conceptual Approach • Transit users’ activity may not be originated from or destined to an individual stop per se • The activity is associated with a specific location in the vicinity of the stop • This location may be “covered” • by several adjacent transit stops Three parameters: Distance, Text, and Catchment area
Developing Stop Aggregation Model (SAM) Stop Aggregation Model: Development and Application (Lee et al. 2012)
Distance-based SAM Stop Aggregation Model: Development and Application (Lee et al. 2012)
Distance-based SAM: Sensitivity of Distance SB Trip One-way CBD Downtown Minneapolis University of Minnesota NB Trip SB Trip NB Trip SB Trip NB Trip Same direction Study route Opposite direction Stop Aggregation Model: Development and Application (Lee et al. 2012)
Case Study • Minneapolis /St. Paul (MN) and Sacramento (CA) Stop Aggregation Model: Development and Application (Lee et al. 2012)
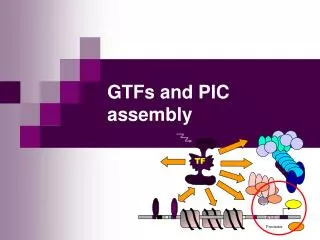
AFC GTFS Parcels • Stop • Aggregation • Model • (SAM) Transit demand Land-Use pattern Aggregate-level O-D estimation Measuring accessibility Identification of boarding and alighting locations Observing land use and activity location Network Development Intermodal Network (e.g., Park-n-Ride) Intersection-level Transit Network Mutually Exclusive Service Areas Use of a Stop Aggregation Model Are Transit Trips Symmetrical in Time and Space? Evidence from the Twin Cities (Lee and Hickman, in press)
Integrating Transit Demand and Land Use General Transit Feed Specification (GTFS) Automated Fare Collection (AFC) Data Stop Aggregation Model Street Network Determination of Transit Service Area Parcel-level Land Use Measurement of Land Use Types Time-varying Transit Demand Linkage Development of a Temporal and Spatial Linkage between Transit Demand Land Use Patterns (Lee et al. 2013)
Street Junction Vehicle Access point to P&R Auto Vehicle P&R Centroid Transit Walk Bus Stop LRT Station Developing Intermodal Network SAM Sunrise Park-and-Ride at Sacramento, CA An Intermodal Shortest and Optimal Path Algorithm using a Transit Trip-based Shortest Path (Khaniet al. 2012)
Intersection-levelOrigin-Destination Estimation • Using AFC data B2 T2 A4 B4 T4 A1 B1 T1 A3 B Boarding stop A Alighting stop Stops serving by Orange Route Stops serving by Red Route T3 A2 B3 Location of Transaction Stop Group of SAM Stop Aggregation Model: Development and Application (Lee et al. 2012)
Linkage with On-Board Survey Data • Spatial references are typically asked of each respondent about where they are coming from and going to Stop Aggregation Model: Development and Application (Lee et al. 2012)
Generating Mutually Exclusive Service Areas • Combination of Thiessen Polygon and Buffer (CTPB) • CTPB approach improves the capability of spatial data integration in direct demand models Case Study: Route 6 Stop Group by SAM CTPB Route-level Mutually Exclusive Service Areas Comparative Study of alternative methods for generating route-level mutually exclusive service areas (Lee et al., in press)
Accessibility: The Nth Nearest Stop Group 1st 2nd 3rd 4th What if 4th stop is better choice with express service at a specific time?
Measuring Transit Accessibility Meters 1,700 ~ 1,800 700 ~ 800 The 1st nearest stop group The 2nd nearest stop group 0 ~ 100 Arbitrary points assigned as facilities in Network Analyst in GIS due to the observance of isolated street network The 3rd nearest stop group The 4th nearest stop group
Quantity of Data Passenger Counts Farecard Data On-board Surveys Household Surveys Behavioral Richness Passenger Behavior Data SAM
Conclusions • Provides the development and application of a stop aggregation model for a transit network based on Google’s General Transit Feed Specification (GTFS) • Aggregate representation of transit stops • Stop groups that serve common or similar land use patterns and activities can be represented by a single node, which is able to reduce the complexity of the transit network • Easily applicable to model passenger transfers, and access time and distance within these stop groups • Utilization of Google’s GTFS • Frequently updated by transit agencies, as it provides detailed information on transit supply-side characteristics
Acknowledgements • Dr. Mark Hickman (University of Queensland, Australia) • Dr. Daoqin Tong (University of Arizona) • University of Arizona Transit Research Unit (UATRU) • East-West Gateway Council of Governments