
1. INTRODUCTION
a 2. r 2. Figure 1 - If the secondary star in a binary fills its Roche lobe and is rotating synchronously, the ratio of its rotational velocity to its projected orbital velocity is a strong function of mass ratio because.

1. INTRODUCTION
E N D
Presentation Transcript
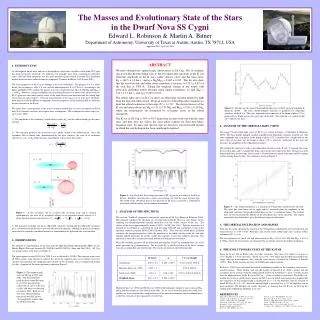
a2 r2 Figure 1 - If the secondary star in a binary fills its Roche lobe and is rotating synchronously, the ratio of its rotational velocity to its projected orbital velocity is a strong function of mass ratio because The Masses and Evolutionary State of the Stars in the Dwarf Nova SS CygniEdward L. Robinson & Martin A. Bitner Department of Astronomy, University of Texas at Austin, Austin, TX 78712, USA(appeared 2007, ApJ, 662, 564) 1. INTRODUCTION As the brightest dwarf nova and one of the brightest cataclysmic variables of any kind, SS Cygni has been extensively observed. Its outbursts, for example, have been continuously monitored since 1896 and their properties are the gold standard against which accretion disk instability models for dwarf nova outbursts must be compared (Cannizzo & Mattei 1992; Lasota 2001). The basic properties of SS Cyg are thought to be well established. The primary star is a white dwarf, the secondary is a K4-5 V star, and the orbital period is P = 0.27624 d. According to the Ritter and Kolb (1998) catalog, the masses of its two component stars MK = 0.704 M and MWD = 1.19 M. However, standard techniques for measuring the masses of binary stars do not work for SS Cyg because the radial velocity curve of the white dwarf is not measured and the orbital light curve does not show eclipses. Previous measurements of the masses of its stars have, therefore, been forced to rely on dubious assumptions about the properties of the accretion disk or about the interior structure of the K star. We report here a measurement of the masses using a method that was first developed for black hole X-ray binaries and does not require these assumptions. The technique has three steps (see, eg, Casares 2005) : 1) The amplitude of the secondary's radial velocity curve, KK, and the orbital period give the mass function 2) The rotational period of the secondary star is tidally locked to the orbital period. Since the secondary fills its Roche lobe (demonstrated by the mass transfer), the ratio of its rotational velocity, Vrot sin i, to KK yields the mass ratio (Figure 1 shows how this works): 3) The distorted secondary star shows ellipsoidal variations. In principle the ellipsoidal variations give a relation between the mass ratio and the orbital inclination, although in practice systematic errors must be carefully considered because of contamination by light from the accretion disk. 2. OBSERVATIONS We obtained 23 spectrograms of SS Cyg with the High Resolution Spectrograph (HRS) on the Hobby-Eberly Telescope between JD 2452084 and JD 2452114 (June and July 2001). SS Cyg was in quiescence at the time (see Figure 2). The spectrograms covered 5300 Å to 7000 Å at a resolution R = 30,000. The exposure times were all 600 seconds, long enough to achieve the necessary signal-to-noise ratio without excessive spectral smearing from the changing radial velocity of the secondary star as it progressed around its orbit. A portion of the mean spectrum is shown in Figure 3. ABSTRACT We have obtained new spectroscopic observations of SS Cyg. Fits of synthetic spectra for Roche-lobe-filling stars to the absorption-line spectrum of the K star yield the amplitude of the K star's radial velocity curve and the mass ratio: KK = 162.5 ± 1.0 km s-1 and q = MK/MWD = 0.685 ± 0.015. The fits also show that the accretion disk and white dwarf contribute a fraction f = 0.535 ± 0.075 of the total flux at 5500 Å. Taking the weighted average of our results with previously published results obtained using similar techniques, we find KK = 163.7 ± 0.7 km s-1 and q = 0.683 ± 0.012. The orbital light curve of SS Cyg shows an ellipsoidal variation diluted by light from the disk and white dwarf. From an analysis of the ellipsoidal variations we limit the orbital inclination to the range 45° < i < 56°. The derived masses of the K star and white dwarf are MK = 0.55 ± 0.13 M and MWD = 0.81 ± 0.19 M, where the uncertainties are dominated by systematic errors in the orbital inclination. The K star in SS Cyg is 10% to 50% larger than an unevolved star with the same mass and thus does not follow the mass-radius relation for Zero-Age Main-Sequence stars. Its mass and spectral type are, however, consistent with models in which the core hydrogen has been significantly depleted. • 4. ANALYSIS OF THE ORBITAL LIGHT CURVE • The mean V-band orbital light curve of SS Cyg is shown in Figure 4 (Voloshina & Khruzina 2000). The basic double-humped variation is produced by ellipsoidal variations of the K star. The extra amplitude and asymmetry of the hump at phase 0.75 is produced by a bright spot on the outer edge of the disk, but the hump at phase 0.25 is relatively unaffected by the spot and measures the amplitude of the ellipsoidal variations. • We modeled the light curve with 1) the ellipsoidal variations of the K star, 2) constant flux from the accretion disk, and 3) variable flux from a spot on the outer edge of the disk. Because q is well determined from spectroscopy, the fit yields a relation between orbital inclination and the amount of flux coming from the disk. The relation is shown in Figure 5. • THE ORBITAL INCLINATION AND MASSES • From the fits to the spectrum the fraction of the V-band flux contributed by the accretion disk and white dwarf is f = 0.54 ± 0.08. With this value the fits to the orbital light curve yield an orbital inclination 45° < i < 56. • The derived masses of the K star and white dwarf are MK = 0.55 ± 0.13 M and MWD = 0.81 ± 0.19 M, where the uncertainties are dominated by systematic errors in the orbital inclination. • THE EVOLUTIONARY STATE OF THE K STAR • Since the K star fills its Roche lobe, its radius is known. The ratio of its radius to its mass is 1.07 ≤ RK/MK≤ 1.47 in solar units. The K star is 10% - 50% larger than the theoretical models for single zero-age main-sequence stars with the same masses calculated by Chabrier & Baraffe (1997). Thus, the K star does not obey the ZAMS mass-radius relation. • Kolb et al. (2001) have calculated theoretical evolutionary models for the secondary stars in mass-transfer binaries. Their models, and also the models of Howell et al. (2001), predict that the secondary star in a binary with the orbital period of SS Cyg should have a mass ~0.2 M greater than the observed mass of the K star in SS Cyg -- if the secondary is unevolved. The Kolb et al. models do, however, predict lower masses for K4-5 stars in which core hydrogen is depleted but not exhausted. If the mixing length is maintained at α = 1.0, the depletion must be extreme to match SS Cyg, Xc = 4 10-4; but if the mixing length is increased to α = 1.9, the depletion can be more moderate. We interpret our results, therefore, as showing that the K star in SS Cyg has significantly depleted the hydrogen in its core. Figure 4 – The dots are the mean V-band orbital light curve of SS Cyg from Voloshina & Khruzina (2000). The basic double-humped variation is produced by ellipsoidal variations of the K star. The extra amplitude and asymmetry of the hump at phase 0.75 is produced by a bright spot on the outer edge of the disk. The solid line is a synthetic light curve fitted to the data. 3. ANALYSIS OF THE SPECTRUM We used our “LinBrod” program to analyze the spectrum of SS Cyg (Bitner & Robinson 2006). This program calculates the spectrum of a star that fills its Roche lobe in a close binary star by summing wavelength-dependent specific intensities over the visible surface of the star. The surface of the star is approximated by many (10,000 – 50,000) flat “tiles.” Specific intensities as a function of wavelength are calculated for each tile using ATLAS9 and a modified version of the spectrum synthesis program MOOG 2002 (Sneden 2002). Then for each orbital phase, LinBrod calculates the emergent intensities, shifts the intensities to the radial velocity of the tile, and adds Doppler-shifted intensities for all the visible tiles together to give the synthetic spectrum. The spectrum is smeared to account for orbital motion and instrumental resolution. We fit the synthetic spectra to all the individual spectrograms of SS Cyg simultaneously (not to the mean spectrum) by χ2 minimization. The fits yield KK, q, and the fraction of the flux f coming from the accretion disk and white dwarf. The results are shown in the following table. Martinez-Pais et al. (1994) and North et al. (2002) used techniques similar to ours to measure KK and q, and their results are also shown in the table. As we see no reason to prefer one result over another, we have calculated the weighted means of the three measurements and recommend them as the best estimates of these parameters for SS Cyg. Figure 3 - Top: Portion of the average spectrum of SS Cyg in the rest frame of the K star. Bottom: Synthetic spectrum for a single, non-rotating star with the same spectral type. The width of the absorption lines in the spectrum of SS Cyg is caused by a combination of rotation, orbital motion, and instrumental resolution. Figure 5 – The orbital inclination as a function of V-band flux contributed by the disk. The solid line from lower left to upper right is measured from the amplitude of the ellipsoidal variations; the parallel dashed lines are the 1-σ confidence limits. The vertical lines are measured from the dilution of the absorption lines in the spectrum. The region enclosed by the dashed lines gives the allowed range of inclinations. Figure 2 - The eruption light curve of SS Cyg in 1981 and 2001. The horizontal bars mark the dates when Hessman et al. (1984) measured the radial velocity curve of SS Cyg in 1981 and when we obtained our data in 2001. Both sets of data were obtained during quiescence but SS Cyg was ~0.6 magnitudes fainter when we obtained our data.


