Comparison of Quantification Techniques in LC-MS for Phosphopeptides
This study compared the accuracy and precision of quantification for phosphopeptides using TIQUAS and SRM approaches in label-free LC-MS. Results showed similar reproducibility, linearity, and precision between the two techniques.

Comparison of Quantification Techniques in LC-MS for Phosphopeptides
E N D
Presentation Transcript
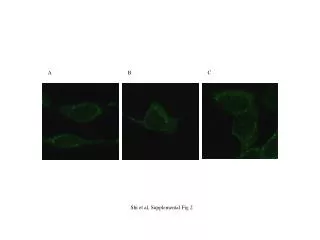
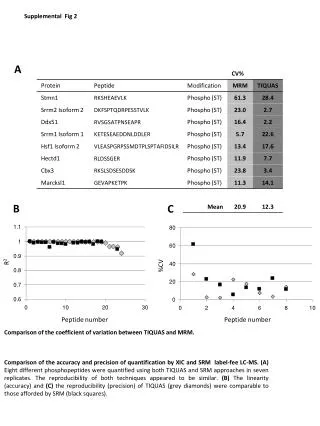
Supplemental Fig 2 A B C R2 %CV Peptide number Peptide number Comparison of the coefficient of variation between TIQUAS and MRM. Comparison of the accuracy and precision of quantification by XIC and SRM label-fee LC-MS. (A)Eight different phosphopeptides were quantified using both TIQUAS and SRM approaches in seven replicates. The reproducibility of both techniques appeared to be similar. (B) The linearity (accuracy) and (C) the reproducibility (precision) of TIQUAS (grey diamonds) were comparable to those afforded by SRM (black squares).