Analysis of Cell Viability and Mortality using Trypan Blue Assay in Response to DMSO Treatment
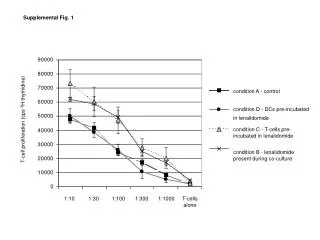
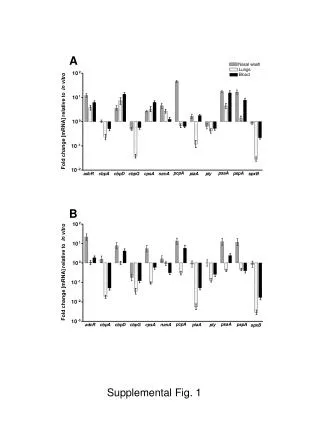
This study utilizes the Trypan Blue cell viability assay to assess the proportion of live and dead cells in 6-well plates, comparing two experimental setups. We present data on live cell counts (x10,000) and dead cell percentages post-DMSO treatment across varying concentrations. Statistically significant differences (p < 0.05) were observed when compared to control conditions, providing insights into the cytotoxic effects of DMSO. These findings contribute to our understanding of the cell viability under specific chemical influences.

Analysis of Cell Viability and Mortality using Trypan Blue Assay in Response to DMSO Treatment
E N D
Presentation Transcript
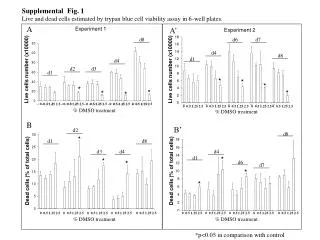
Supplemental Fig. 1 Live and dead cells estimated by trypan blue cell viability assay in 6-well plates. A Experiment 1 A’ Experiment 2 d8 d6 d7 d4 d8 d1 d4 d2 d3 Live cells number (x10000) Live cells number (x10000) d1 * * * * * * * * 0 0.5 1.25 2.50 0.5 1.25 2.50 0.5 1.25 2.5 0 0.5 1.25 2.5 0 0.5 1.25 2.5 % DMSO treatment 0 0.5 1.25 2.50 0.5 1.25 2.50 0.5 1.25 2.5 0 0.5 1.25 2.50 0.5 1.25 2.5 % DMSO treatment B B’ d2 d8 * d1 d8 d3 d4 d4 * d1 * * d6 d7 * Dead cells (% of total cells) Dead cells (% of total cells) * *p<0.05 in comparison with control 0 0.5 1.25 2.50 0.5 1.25 2.50 0.5 1.25 2.5 0 0.5 1.25 2.5 0 0.5 1.25 2.5 % DMSO treatment 0 0.5 1.25 2.50 0.5 1.25 2.50 0.5 1.25 2.5 0 0.5 1.25 2.5 0 0.5 1.25 2.5 % DMSO treatment *p<0.05 in comparison with control