Download
1 / 6
60 likes | 169 Vues
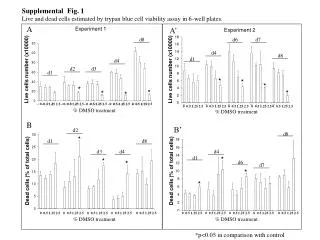
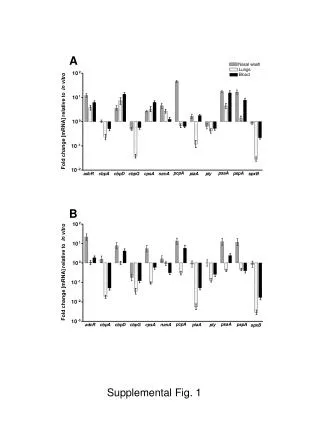
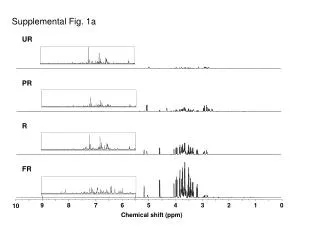
This document analyzes supplemental figures illustrating chemical shift data. Figures 1a-c outline chemical shifts (in ppm) related to different experimental conditions, detailing the variations observed across multiple parameters (PC.1 and PC.2 values). Supplemental figures 2a-c further elaborate on the trends and behaviors of chemical shifts, highlighting the distribution across various variables and percentages. Understanding these shifts is crucial for interpreting the underlying chemical phenomena and their implications in experimental and theoretical contexts.

E N D
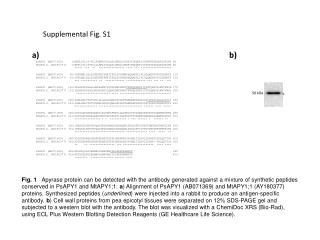
Supplemental Fig. 1a UR PR R FR 9 8 7 6 5 4 3 2 1 0 10 Chemical shift (ppm)
Supplemental Fig. 1b UR PR R FR 9 8 7 6 5 4 3 2 1 0 10 Chemical shift (ppm)
Supplemental Fig. 1c UR PR R FR 9 0 8 7 6 5 4 3 2 1 Chemical shift (ppm)
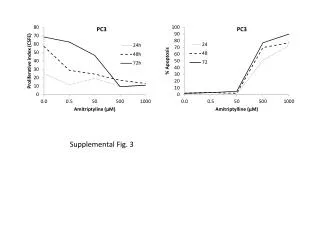
1.0 0.5 PC 2 (25.0%) 0.0 -0.5 -1.0 -1.6 -1.2 -0.8 -0.4 0.4 0.8 1.2 1.6 0 PC 1 (53.6%) Supplemental Fig. 2a UR PR FR R
0.6 0.4 PC 2 (11.8%) 0.2 -0.0 -0.2 -0.4 -0.6 -1.6 -1.4 -1.2 -1.0 -0.8 -0.6 -0.4 -0.2 0.0 0.2 0.4 0.6 0.8 1.0 1.2 1.4 1.6 PC 1 (73.8%) Supplemental Fig. 2b UR PR FR R
0.3 0.2 PC 2 (17.2%) 0.1 0.0 -0.1 -0.2 -0.3 -0.6 -0.5 -0.4 -0.3 -0.2 -0.1 0.0 0.1 0.2 0.3 0.4 0.5 0.6 PC 1 (50.9%) Supplemental Fig. 2c UR PR FR R