Impact of Mss4 Down-regulation on Integrins and Cell Motility
Investigation of Mss4 down-regulation effects on integrin expression and cell motility in C2C12 cell clones using WB analysis and FACS scanning.

Impact of Mss4 Down-regulation on Integrins and Cell Motility
E N D
Presentation Transcript
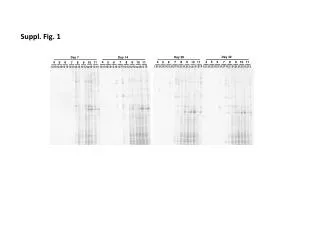
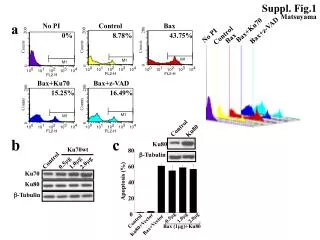
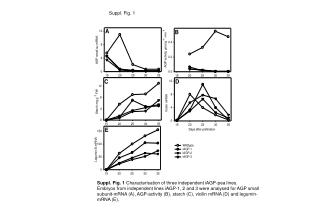
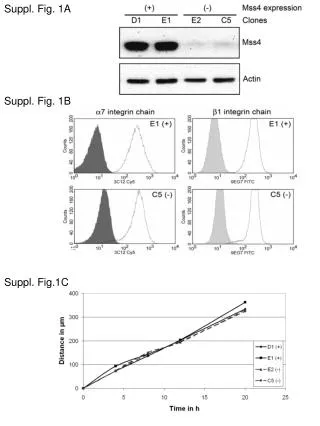
Suppl. Fig. 1A Suppl. Fig. 1B Suppl. Fig.1C
Supplementary Figure 1. Down-regulation of Mss4 does not affect expression of integrins or cell motility on already pre-coated surfaces. (A)WB analysis of endogenous Mss4 protein in four C2C12 clones after stable introduction of Mss4 siRNA. -actin blot serves as loading control. Primers for siRNA were cloned into a retroviral vector and after obtaining virus producer cells, mouse C2C12 myoblasts were infected with supernatants of these cells and subsequently selected for G418 resistance. As the Mss4 expression in these cells was variable, we subcloned them to obtain cells with a stable down-regulation of Mss4. Analysis of 31 clones showed that only in roughly one third the Mss4 protein was significantly down-regulated, while in others nearly no effect was registered. We chose two Mss4 expressing (+) clones (D1 and E1) and two low-expressing (-) clones (C5 and E2), in which the level of Mss4 was significantly down-regulated and further experiments were performed with these four cell sublines. To ensure that Mss4 in these clones is indeed stably down-regulated, its expression was additionally tested by RT-PCR or real-time PCR 6 and 18 month after subcloning. At all times tested the RNA level of Mss4 was significantly lower in low-expressing than in expressing clones. (B) FACSscan analysis of integrins on Mss4 expressing and low-expressing cells. The expression of 7- and 1-integrin chains was detected with 3C12 and 9E7G specific mAb, respectively. The filled curves represent stainings with secondary antibodies only, while the open curves - stainings with specific first antibodies + Cy5- or FITC-labelled secondary antibodies. (C) Migration of Mss4 expressing and low-expressing cells was analyzed on fibronectin or laminin-1 coated surfaces. Only migration on FN is shown here. Also attachment or spreading on FN was not changed after down-regulation of Mss4 (data not shown).