Characterization and Functional Analysis of CaSAMDC in Hot Pepper and Transgenic Arabidopsis
This study investigates the nucleotide and amino acid sequences of CaSAMDC (GenBank Accession No. JX875948), revealing a full-length sequence of 1,681 bp including a 5’-UTR, coding region, and 3’-UTR. Transgenic Arabidopsis plants expressing CaSAMDC were analyzed for drought and cold stress responses through semi-quantitative RT-PCR and Southern blotting. The analysis includes phylogenetic relationships with other plant SAMDCs and the effects of abiotic stresses on gene expression and polyamine biosynthesis. Our findings elucidate CaSAMDC's potential role in stress tolerance.

Characterization and Functional Analysis of CaSAMDC in Hot Pepper and Transgenic Arabidopsis
E N D
Presentation Transcript
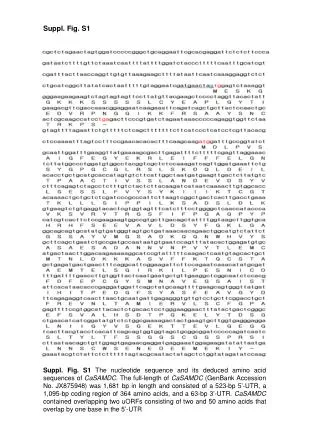
Suppl. Fig. S1 Suppl. Fig. S1 The nucleotide sequence and its deduced amino acid sequences of CaSAMDC. The full-length of CaSAMDC (GenBank Accession No. JX875948) was 1,681 bp in length and consisted of a 523-bp 5’-UTR, a 1,095-bp coding region of 364 amino acids, and a 63-bp 3’-UTR. CaSAMDC contained overlapping two uORFs consisting of two and 50 amino acids that overlap by one base in the 5’-UTR
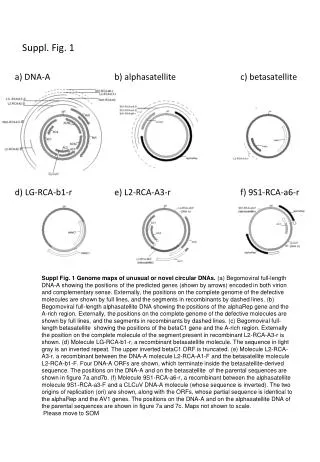
Suppl. Fig. S2 a b
Suppl. Fig. S2 Sequence analysis of hot pepper CaSAMDC. a Multiple alignments of 10 plant SAMDC genes. The predicted amino acid sequence of CaSAMDC (GenBank Accession No. JX875948) was compared with those of proteins from carnation (CSAMDC1, U38526; CSAMDC2, U38527), Arabidopsis (ASAMDC1, U63633; ASAMDC2, AJ251915), morning glory (InSAMDC, AAC04611), tobacco (NtSAMDC, U91924), soybean (GmSAMDC, AF488307), cottonwood (PtSAMDC, EEF07896) and tomato (SiSAMDC, ABY55855). Amino acid sequences conserved in all ten proteins are indicated in black. bPhylogenetic relationship of the ten SAMDCs from various plant species
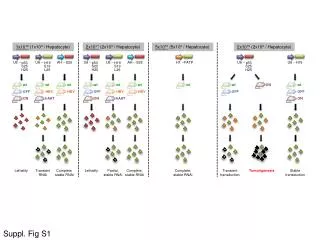
Suppl. Fig. S3 HindIII BamHI HindIII ATG TAA 227 379 150 437 524 950 1544 • 1618 • 1681 1 pBI121 NPTII 35S CaSAMDC RB LB NOS-pro NOS-ter NOS-ter Suppl. Fig. S3 A Schematic representation of the CaSAMDC-overexpressing gene construct in the pBI121 vector. LB, left border; NOS-Ter, terminator sequence from nopalinesynthase gene; 35S, CaMV 35S promoter; NPT II, neomycin phosphotransferase; NOS-Pro, promoter sequence from nopalinesynthase gene; RB, right border
Suppl. Fig. S4 ScaI SacI Col-0 #2 #4 Col-0 #2 #4 Kb 10.0 8.0 5.0 4.0 3.5 3.0 2.5 Suppl. Fig. S4 Genomic Southern blot analysis of WT and 35S::CaSAMDC transgenic Arabidopsis lines #2 and #4. Genomic DNA (10 μg per lane) from Arabidopsis seedlings was digested with ScaI and SacI enzymes, blotted onto nylon membranes, and hybridized with the [32P]-labeled cDNA probe under normal stringent conditions. The blot was visualized by autoradiography
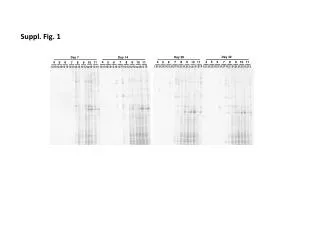
Figure S5. a b Drought 35S:CaSAMDC Col-0 #2 #3 #4 #5 #6 #10 0 1 2 h CaSAMDC CaSAMDC AtUBC10 CaLEA-1 CaActin c ** Cold * 0 12 24 36 h CaSAMDC CaDhn CaActin d Mock ABA 0 1 4 1 4 h ** ** CaSAMDC ** ** CaDhn CaActin ** **
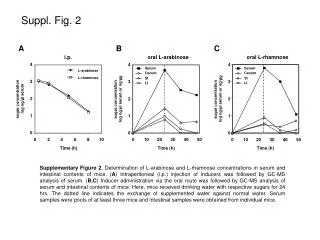
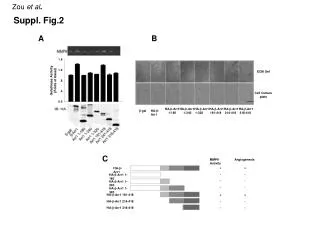
Suppl. Fig. S5 Patterns of transcription and PA biosynthesis in response to abiotic stresses in aerial parts of hot pepper (Capsicum annum) and transgenic Arabidopsis plants overexpressingCaSAMDC. a Semi-quantitative RT-PCR analysis of CaSAMDC, CaLEA-1, and CaDhn transcription after drought stress (upper panel), cold stress (middle panel), and ABA treatment (lower panel) using total RNAs from aerial parts of hot pepper. CaActin was used as an equal loading control. b Semi-quantitative RT-PCR analysis of CaSAMDC transcription in WT (Col-0) and CaSAMDC-overexpressing Arabidopsis plants without stress treatment. Total RNA from each Arabidopsis line was used, and AtUBC10 was used as a loading control. Primers used in RT-PCR analyses are listed in Suppl.Table S1. c Changes in SAMDC activity in WT and transgenic Arabidopsisplants (#2 and #4). SAMDC activity was measured in the aerial parts of 2-week-old Arabidopsis seedlings without any abiotic stress. SAMDC activity is shown as the mean ± SD. Asterisk indicates significant difference at P < 0.06 when comparing data by Student’s ttest for each measurement between WT and transgenic plants (#2 and #4). d Changes in PA levels in WT and transgenic Arabidopsis plants (#2 and #4). PAs were measured in the aerial parts of 2-week-old Arabidopsis plants without any abiotic stress. Total PA level is the sum of three PA levels. PAs levels are shown as the meas± SD. Put, putrescine; Spd, spermidine; Spm, spermine. Asterisk indicates significant difference at one (P < 0.05) or two (P < 0.01) when comparing data by Student’s ttest for each measurement between WT and transgenic plants (#2 and #4)
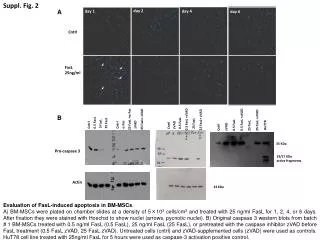
Suppl. Fig. S6 a 35S::CaSAMDC Col-0 #2 #4 #5 #10 3-week-old plants 11 days without watering 3 days after re-watering 20 % (8/40) 90 % (33/40) 65 % (26/40) 6 0% (24/40) 50 % (20/40) b * * ** ** ** ** * *
Suppl. Fig.S6 Phenotypic analyses of WT and CaSMADC-overexpressing transgenic plants in response to drought stress. a Drought tolerance of WT and transgenic plant lines #2, #4, #5, and #10. WT and transgenic plants were grown under normal growth conditions for 3 weeks and then exposed to drought stress by withholding water for 11 days. Surviving plants were counted 3 days after rewatering. b Water contents of detached leaves from transgenic Arabidopsis plants that were incubated at room temperature under dim light. Reduction of fresh weights was measured at the indicated time points. Water loss rates were estimated as the percentage of initial to final fresh weights. Data are shown as the mean± SD. Asterisk indicates significant difference at one (P < 0.05) or two (P < 0.01) when comparing data by Student’s ttest for each measurement between WT and transgenic plants (#2 and #4)