Impact of Kynurenine and Cytokine Concentrations on Thymidine Incorporation and ICAM Expression
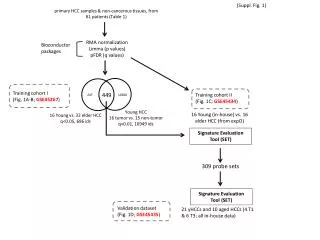
This study investigates the effects of varying concentrations of kynurenine and cytokine cocktail on 3H-thymidine incorporation, an indicator of cell proliferation, and the expression of critical adhesion molecules like ICAM and PDL1 in MCEC cells. Supplementary figures illustrate the dose-dependent response of thymidine incorporation with 3H-thymidine assays under different kynurenine concentrations. Additionally, the upregulation of ICAM by ICOSL and the apoptosis rates in response to cytokine exposure are assessed, providing insights into cellular dynamics under inflammatory conditions.

Impact of Kynurenine and Cytokine Concentrations on Thymidine Incorporation and ICAM Expression
E N D
Presentation Transcript
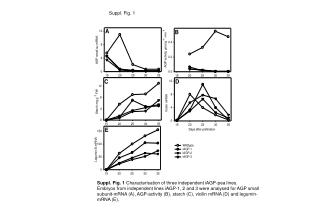
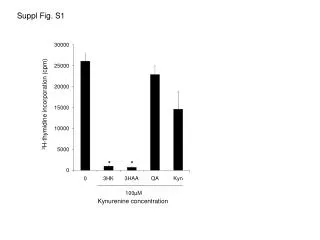
Suppl Fig. S1 3H-thymidine incorporation (cpm) * * 100μM Kynurenine concentration
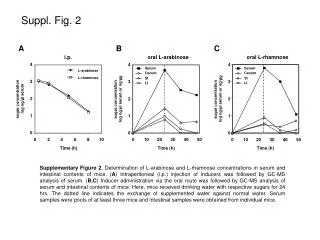
100 µM 10 µM 0 µM 3HK 0 µM 100 µM 10 µM 3HAA Suppl Fig. S2 25 µM 0 µM 50 µM 100 µM 3HK A 25 µM 50 µM 100 µM 0 µM 3HAA B
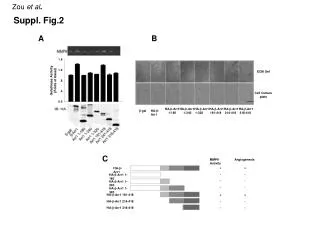
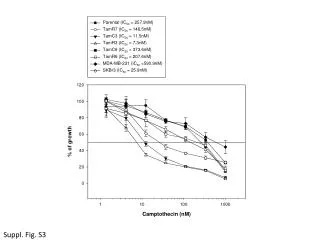
Suppl Fig. S3 Kyn 3HK 3HAA QA ICOSL QA induced upregulation of ICAM ICAM Isotype ctrl Basal PDL1 expression on MCEC PDL1 Class II
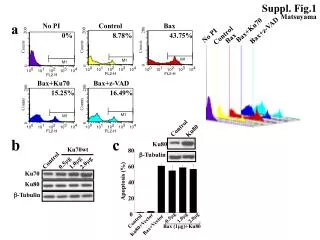
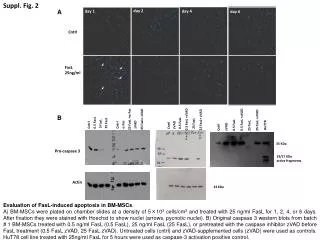
Suppl Fig. S4 % Apoptosis 0 10 100 Cytokine cocktail (ng/ml)