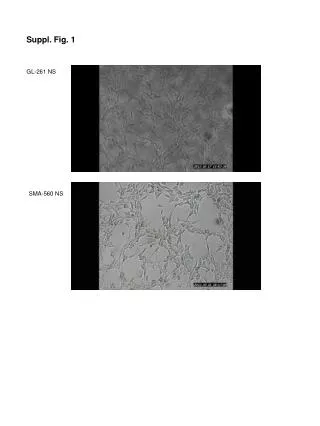
(Suppl. Fig . 1)
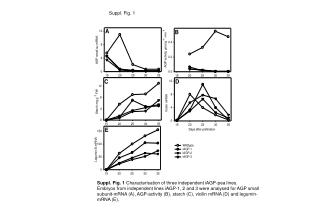
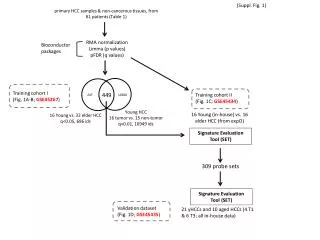
(Suppl. Fig . 1). primary HCC samples & non-cancerous tissues, from 61 patients (Table 1). RMA normalization Limma (p values) pFDR (q values). Bioconductor packages. Training cohort I (Fig. 1A-B; GSE45267 ). 449. Training cohort II (Fig. 1C; GSE45434 ). 247. 10500. Young HCC

(Suppl. Fig . 1)
E N D
Presentation Transcript
(Suppl. Fig. 1) primary HCC samples & non-cancerous tissues, from 61 patients (Table 1) RMA normalization Limma (p values) pFDR (q values) Bioconductor packages Training cohort I (Fig. 1A-B; GSE45267) 449 Training cohort II (Fig. 1C; GSE45434) 247 10500 Young HCC 16 tumor vs. 15 non-tumor q<0.01, 10949 ids 16 Young (in-house) vs. 16 elder HCC (from expO) 16 Young vs. 32 elder HCC q<0.05, 696 ids Signature Evaluation Tool (SET) 309 probe sets Signature Evaluation Tool (SET) Validation dataset (Fig. 1D; GSE45435) 21 yHCCs and 10 aged HCCs (4 T1 & 6 T3; all in-house data)