Food-inducible IVRC for Gut Microbiota Imaging in Mice
A study using Bioluminescence to track gut bacteria light emission in mice fed with specific diets before plasmid-administered bacteria.

Food-inducible IVRC for Gut Microbiota Imaging in Mice
E N D
Presentation Transcript
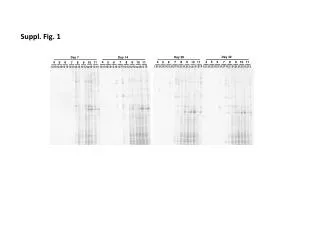
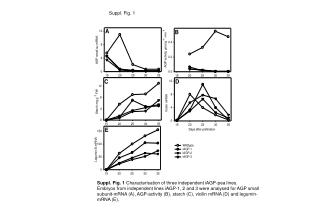
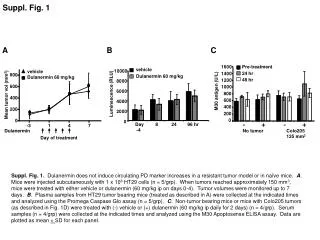
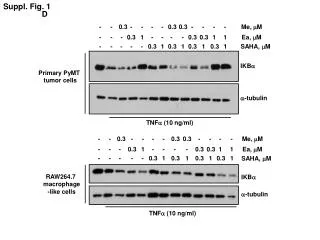
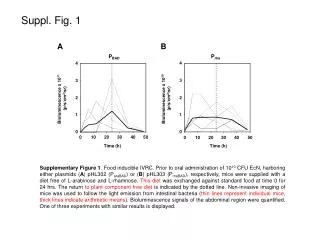
Suppl. Fig. 1 A B PBAD Prha 4 4 3 3 Bioluminescence x 1010 (p/s/cm2/sr) Bioluminescence x 1011 (p/s/cm2/sr) 2 2 1 1 0 0 0 10 20 30 40 50 0 10 20 30 40 50 Time (h) Time (h) Supplementary Figure 1. Food inducible IVRC. Prior to oral administration of 1010 CFU EcN, harboring either plasmids (A) pHL302 (ParaBAD) or (B) pHL303 (PrhaBAD), respectively, mice were supplied with a diet free of L-arabinose and L-rhamnose. This diet was exchanged against standard food at time 0 for 24 hrs. The return to plant component free diet is indicated by the dotted line. Non-invasive imaging of mice was used to follow the light emission from intestinal bacteria (thin lines represent individual mice, thick lines indicate arithmetic means). Bioluminescence signals of the abdominal region were quantified. One of three experiments with similar results is displayed.