Grade Level Expectations
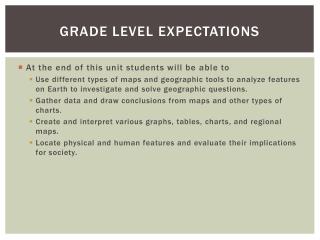
Grade Level Expectations. At the end of this unit students will be able to Use different types of maps and geographic tools to analyze features on Earth to investigate and solve geographic questions. Gather data and draw conclusions from maps and other types of charts.

Grade Level Expectations
E N D
Presentation Transcript
Grade Level Expectations • At the end of this unit students will be able to • Use different types of maps and geographic tools to analyze features on Earth to investigate and solve geographic questions. • Gather data and draw conclusions from maps and other types of charts. • Create and interpret various graphs, tables, charts, and regional maps. • Locate physical and human features and evaluate their implications for society.
Studying Geography Lesson 1
Themes and Essential Elements • Geography • The study of Earth’s natural environment, how the natural environment influences people, how people’s activities affect Earth, and how the world is changing.
Geographers use spatial perspective to see patterns in where things are located and how they are arranged. • Geographers see the world as various landscapes: the scenery of a place, including its physical, human, and cultural features.
There are two main types of geography: • Human geography is the study of the distribution and characteristics of the world’s people. • Physical geography focuses on Earth’s natural environments. • The interaction of people with the natural environment links the two together.
Subfields of Geography • Cartography • The study of maps and map making. • Meteorology • The study of weather.
Regions • A region is an area with one or more common features that makes it different from surrounding areas. • Regions are defined by their physical and human features. • Regions can be any size.
Types of Regions • A formal region has one or more common features that make it different from surrounding areas. • A functional region is composed of different places that are linked together and function as a unit. • A perceptual region is a region that reflects human feelings and attitudes.
The Five important themes of geography • Location: deals with the exact or relative spot of something on Earth. • Place: includes the physical and human features of a location. • Human-environment interaction: the ways people and environments interrelate with and affect each other. • Movement: how people and things change locations and the effects of these changes. • Region: organizes Earth into geographic areas with one or more shared characteristics.
Organizing the Globe • A globe is a scale model of Earth. • Lines circle the globe from east to west and north to south forming a grid. • The north to south lines are called longitude lines and measure distance around the globe. They are also called meridians. • They are measured in 15 degree increments beginning with 0 and ending with 180 and go east and west. • Example: 30 degrees west is west of the O or Prime Meridian while 30 degrees east is east of 0 or Prime Meridian.
The east to west lines are called latitude lines and measure the distance north and south. They are also called parallels. • They are measured in 10 degree increments beginning with 0 and ending with 90 and go north and south. • Example: 20 degrees north is north of 0 or Equator while 20 degrees south is south of 0 or Equator. • The intersection of these imaginary lines helps one to find the location of places. • Degrees can be further divided into minutes (‘) and seconds (“).
Hemispheres, Continents, and Oceans • The globe can be divided into two halves using either the prime meridian/international date lines or by using the equator. • The prime meridian/international date lines divide the globe into the eastern and western hemispheres. • The equator divides the globe into the northern and southern hemispheres.
The globe can also be divided by land masses and large bodies of water: continents and oceans. • There are seven continents: Africa, Asia, Europe, North America, South America, Antarctica, and Australia. • There are four major oceans: Atlantic, Arctic, Pacific, and Indian.
Making Maps • Maps are flat representations of all or part of Earth’s surface. • A collection of maps in one book is called an atlas. • The round Earth is depicted on flat maps by making map projections. • Map projections have some distortion because round objects cannot be flattened without separating areas or crushing areas.
There are three types of map projections: cylindrical projections, conic projections, and flat-plane projections. • Cylindrical projections are designed as if a cylinder has been wrapped around the globe. The cylinder only touches the globe at the equator and the meridians are pulled apart and are parallel to each other instead of meeting at the poles. This causes land masses near the poles to appear larger than they really are. • One type of cylindrical projection is a Mercator map.
Conic projections are designed as if a cone were placed over the globe. It is most accurate along the lines of latitude where it touches the globe. They are most useful for areas that have long east-west dimensions. • Flat-plane maps are those that appear to touch the globe at one point, such as the North Pole or South Pole. It is useful for showing true direction for airplane pilots and ship navigators. It also shows true area sizes, but it distorts shapes.
Great-Circle Route • The shortest route between any two places on the planet is called a great-circle route. • Flying north or south might be shorter than flying due east or west.
Map elements • Distance scales: a map’s distance scale helps one to determine real distances between points on a map. • Directional indicators: a directional indicator show which directions on a map are north, south, east or west. Many maps use a compass rose – has arrows that point to all four principal directions. • Legends: a map’s legend, or key, identifies the symbols on a map and what they represent. Legends show colors or symbols that represent many different kinds of features on a map. • Inset maps: used to focus in on a small part of a larger map.
Types of Maps • Climate and Precipitation Maps • Climate maps use color to show the various climate regions of the world. Colors that identify climate types are found in a legend. Boundaries mark areas of gradual change between climates. • Precipitation maps show the average amount of precipitation that a region gets each year. Each map’s legend uses colors to identify those amounts.
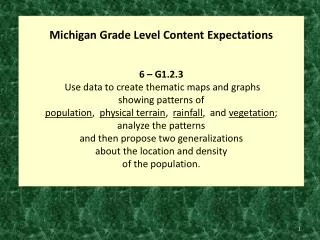
Population and Economic Maps • Population maps give you a snapshot of the distribution of people in a region. Each color on a population map represent an average number of people living within a square mile or square kilometer. • Economic maps show a region’s important natural resources and the ways in which land is used. Symbols show the location of resources, such as oil and gold. Colors show where land is used for farming or other economic activities.
Elevation Profiles and Topographic Maps • Elevation profiles show a side view of a place or area. The profile shows the physical features of the area from point a to point b. • Vertical and horizontal distance are calculated differently. The vertical distance is exaggerated when compared to the horizontal distance. If the vertical scale were not exaggerated, even tall mountains would appear as small bumps on an elevation profile.
Topographic maps show the elevation, layout, and shapes of the land. • Contour maps provide a way of looking at shapes of land in an area. They use contour lines to connect points of equal elevation above or below sea level. Elevation levels are written on the lines. The closer together the lines, the steeper the land.
Climate graphs and Population Pyramids • Climate graphs show the average temperatures and precipitation of a region. • Temperature ranges are found on the left side of the graph while precipitation ranges are found on the right side of the graph. • Average temperatures for each month are graphed using dots and then connecting those dots to show the change throughout the year. • Average precipitation for each month are graphed using bars.
Population pyramids show the percentages of males and females by age group in a country’s population. • Males are grouped by age on the left side of the pyramid and females are grouped by age on the right side of the pyramid. • Population pyramids help one to understand population trends in countries.