Download

1 / 14
140 likes | 278 Vues
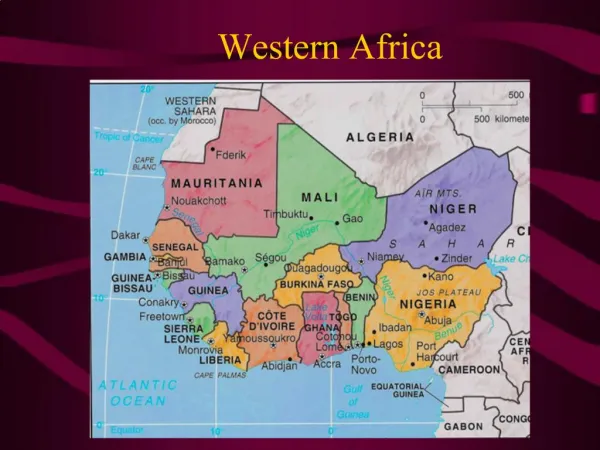
This case study explores air quality events in Western and Central Africa, focusing on data gathered from satellite imagery and atmospheric models on December 26, 2008. Utilizing MODIS-Terra true color images and aerosol optical depth data, significant insights into air pollution levels across countries like Ivory Coast, Ghana, and Nigeria are provided. The study also incorporates nitrogen dioxide measurements and back-trajectory analyses from NOAA’s HYSPLIT model, offering a comprehensive view of regional air quality dynamics.

E N D
Map of the Air Quality Event RegionWestern and Central Africa http://www.mapsofworld.com/africa-political-map.htm Region of Air Quality Event
MODIS-Terra True Color ImagesWestern Africa (Ivory Coast, Ghana, Togo, Benin, Nigeria)December 26th, 2008(http://rapidfire.sci.gsfc.nasa.gov/subsets/)
MODIS-Terra True Color ImagesCentral Africa (Central African Republic, Congo, DRC, Uganda, Sudan)December 26th, 2008(http://rapidfire.sci.gsfc.nasa.gov/subsets/)
MODIS Terra Aerosol Optical Depth (Level 3) Western and Central AfricaDecember 26th, 2008 (http://giovanni.gsfc.nasa.gov)
OMI Aerosol Index (Level 3)Western and Central AfricaDecember 26th, 2008 (http://giovanni.gsfc.nasa.gov)
OMI Nitrogen DioxideCentral Africa http://www.temis.nl/airpollution/no2col/no2regioomi_col3.php December 26th, 2008
OMI Nitrogen DioxideWestern Africa http://www.temis.nl/airpollution/no2col/no2regioomi_col3.php December 26th, 2008
5-day Back-Trajectories Ending in the Democratic Republic of Congo (right) and Nigeria (left)HYSPLIT On-line Transport Modelhttp://www.arl.noaa.gov/ready/open/hysplit4.html
5-day Back-Trajectories Ending in Ivory CoastHYSPLIT On-line Transport Modelhttp://www.arl.noaa.gov/ready/open/hysplit4.html
Meteorological Information Available on the Internet • Hourly Weather Observations(temperature, winds, visibility, etc.) • Weather Underground:http://www.wunderground.com/ • Type “Nigeria” in the box at the top of the page, and hit enter. • Scroll down to the list of cities and click on “Abuja”. • Select the date of interest under “History and Almanac”. • Repeat for Yamoussoukro, Ivory Coast • Repeat for Bangui, Central African Republic
True Color and AOD Images Available on the Internet • True Color Images MODIS instrument:http://rapidfire.sci.gsfc.nasa.gov/subsets/ • Click on region of interest. • Click on the “display alternate dates available for this subset” link. • Select date of interest (dates are in Julian date format). • Repeat for all overlapping regions of interest. • True Color and AOD Images MODIS instrument:http://ladsweb.nascom.nasa.gov/browse_images/l2_browser.html • Select “Terra” or “Aqua” satellite • Select appropriate “month,” “day,” and “year.” • Select “parameter” from pull-down menu; “RGB” = true color images Parasol satellite:http://www-icare.univ-lille1.fr/parasol/browse/ • Click the box next to “Aerosol Optical Thickness over land” and “865 nm Optical Thickness over ocean” to view aerosol images. • AOD Images OMI instrument:http://toms.gsfc.nasa.gov/aerosols/aerosols_v8.html • Scroll to the bottom of the page to select images. • Select “global image” from “Choose output” pull-down menu. • Select “OMI: 8/17/2004 – Present” from “coverage satellite” pull-down menu. • Select appropriate “Date to be studied.”
HYbrid Single-Particle Lagrangian Integrated Trajectory(HYSPLIT) Analysis • NOAA Air Resources Laboratory HYSPLIT Model • http://www.arl.noaa.gov/ready/open/hysplit4.html • Under the “HYSPIT” pull-down menu, select “run with archived data”. • Select “compute trajectories”. • Choose the “GDAS (global, 2005-present)” archived meteorological dataset. • Select the desired archive file. • Choose 1 trajectory starting location. • Enter the WMO code for the city where you would like to base the trajectory: • Model Run Time Options: • Select a forward or back trajectory. • Select the appropriate start or end date; select “16” UTC for the time (2 PM local). • Type in “1000” for “Start height 2” and “1500” for “Start height 3”. • LEAVE EVERYTHING ELSE UNCHANGED. • Scroll to the bottom and click “request trajectory”. • Wait for your results; when they are done, click on “your trajectory plot”.
Sources of Satellite Data and Imagery Moderate Resolution Imaging Spectroradiometer (MODIS) description: http://modis-atmos.gsfc.nasa.gov/ MODIS Rapid Response System: http://rapidfire.sci.gsfc.nasa.gov/ MODIS direct broadcast site: http://eosdb.ssec.wisc.edu/modisdirect/ MODIS Level 2 LAADS data browser: http://ladsweb.nascom.nasa.gov/browse_images/l2_browser.html The Smog Blog: http://alg.umbc.edu/usaq/ NASA Earth Observatory: http://earthobservatory.nasa.gov/ NASA Visible Earth: http://visibleearth.nasa.gov/ NASA Giovanni: http://giovanni.gsfc.nasa.gov CALIPSO satellite: http://www-calipso.larc.nasa.gov/products/lidar/ NRL Fire Locating and Modeling of Burning Emissions (FLAMBE) Google Earth Download http://www.nrlmry.navy.mil/flambe/ Tropospheric Emission Monitoring Internet Service (European): http://www.temis.nl/ Satellite Products for Europe (German Remote Sensing Data Center): http://www.dlr.de/caf/en/desktopdefault.aspx/tabid-2683/4049_read-6052/ India Meteorological Department Satellite Images and Products (INSAT satellite): http://www.imd.ernet.in/section/satmet/dynamic/insat.htm EUMETSAT Image Gallery (Europe and Africa): http://www.eumetsat.int/Home/Main/Image_Gallery/Real-time_Images/index.htm