Download
1 / 20
200 likes | 277 Vues
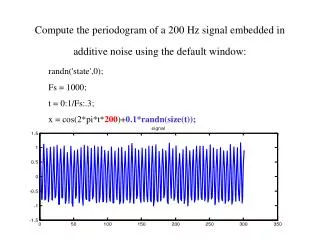
Compute the periodogram of a 200 Hz signal embedded in additive noise using the default window:. randn('state',0); Fs = 1000; t = 0:1/Fs:.3; x = cos(2*pi*t* 200 )+ 0.1*randn(size(t));. periodogram (x,[],'twosided',512,Fs). X=corrmtx(x,20); % Correlation matrix for leg = 20

E N D
Compute the periodogram of a 200 Hz signal embedded in additive noise using the default window: randn('state',0); Fs = 1000; t = 0:1/Fs:.3; x = cos(2*pi*t*200)+0.1*randn(size(t));
X=corrmtx(x,20); % Correlation matrix for leg = 20 imagesc(X'*X);
1 6 11 16 +5 +5 +5
x = cos(2*pi*t*200)+0.4*randn(size(t)); x = cos(2*pi*t*200)+0.1*randn(size(t));
x = cos(2*pi*t*200)+0.8*randn(size(t)); x = cos(2*pi*t*200)+0.1*randn(size(t));
x = cos(2*pi*t*200)+0.8*randn(size(t)); x = cos(2*pi*t*200)+0.1*randn(size(t));
x = cos(2*pi*t*200)+0.4*randn(size(t)); Covariance matrix x = cos(2*pi*t*200)+0.8*randn(size(t));
x = cos(2*pi*t*100)+0.4*randn(size(t)); x = cos(2*pi*t*200)+0.4*randn(size(t));
Yukarıdaki covariance matrix, aşağıdaki işarete ait olabilir mi? x = cos(2*pi*t*400)+0.4*randn(size(t));
AR MODEL a = aryule(x,4); A = [1.0000 -0.2356 0.6802 0.4158 -0.0724] freqz(1,a,512,'whole',Fs);
y = filter(1,a,x); periodogram(y,[],'twosided',512,Fs);
Filtrelenmiş işaretin periodogram’ı alındı. Gürültüden arındırılmış bir periodogram elde edildi. Herhangi bir filtre ile filtrelendikten sonra periodogram alınsa aynı sonuç elde edilir mi?
a = [1.1352 -0.3746 -0.4832 1.5995 -0.0878] y = filter(1,a,x); periodogram(y,[],'twosided',512,Fs);
a = [1.1352 -0.3746 -0.4832 1.5995 -0.0878] freqz(1,a,512,'whole',Fs);