Comprehensive Overview of Statistical Graphs for Data Representation
280 likes | 302 Vues
Explore different types of statistical graphs like line, bar, pie, histogram, and scatter plots for effective data visualization in statistics. Understand how each graph type represents data without complex calculations or analysis.

Comprehensive Overview of Statistical Graphs for Data Representation
E N D
Presentation Transcript
Statistics graph Data recorded in surveys are displayed by a statistical graph. There are some specific types of graphs to study in the data statistics graphs. There are eleven type of graphs used in Data statistics graphs
Type of graphs • Box plot, • Stem and leaf plot, • Frequency polygon, • Scatter plot, • Line graph, • Bar graph, • Histogram, • Pictograph, • Map chart, • Pie chart, • Line plot.
Introduction to types of statistical graphs: Let us see some content about types of statistical graphs. The statistical data's are used to represent by some graphs format. The statistical data's are either continuous or discontinuous. There are more types of statistical graphs. Each and every graph is used in various purposes. The graphs and charts are commonly used by the business trends.
Types of Statistical Graphs: There are several types of statistical data. Each graph is used to show the data levels of the business without the any calculations. The types of statistical graphs are following below: • Statistical graph 1: Line graph. • Statistical graph 2: Bar graph. • Statistical graph 3: Pie chart. • Statistical graph 4: Histogram. • Statistical graph 5: Scatter plot. These are the types of the statistical graphs used to draw the statistical data's.
Statistical graph 1: Line graph: The line graph is used to conspire the continuous data. The data's are plotted as points. The points are joined by the lines. This graph is used to compare multiple data sets. But the line graph only using continuous data's.
Statistical graph 2: Bar graph: The bar graph displays discrete data in disconnect columns. A double bar graph can be used to evaluate two data sets. It is visually muscular. It is used to easily evaluate two or three data sets. It uses only discrete data.
Statistical graph 3: pie chart: The pie chart displays data as a percentage of the whole. It displays the percentage of each category. But, it has no exact data's.
Statistical graph 4: Histogram: The histogram shows the continuous data in order to columns. It is same as the line graph but it is represented as in column format.
Graphical Representation of Statistical Data A histogram is a two-dimensional graphical representation of a continuous frequency distribution.A histogram is a special type of bar diagram.
Histogram A histogram is a way of summarizing data pictorially. Histograms show the distribution of the data. They are constructed from a frequency table, which is a summary of the data. The general format for a histogram is a vertical scale that demonstrates frequencies and a horizontal scale that represents the individual intervals, sometimes called classes. Bars are used to represent each individual interval with the height of the bar corresponding to the frequency.
A histogram is drawn according to the steps given below. • Prepare a grouped frequency distribution table of the given data. • Show class-limits on X-axis with a suitable scale. • Show frequencies on Y-axis with a suitable scale. • Draw rectangles having base equal to the class limits and heights proportional to the frequencies. These rectangles should be joined to each other.
The following points can be inferred from the above histogram. • It is not necessary that the scale on the X-axis and the Y-axis be the same. Different scales may be taken on the axes considering the nature of the data, size of the paper etc. A histogram should look neat and attractive. • The position of origin on the Y-axis is according to the scale, which is not so on the X - axis. This is indicated by drawing √mark on
The X-axis near the origin. If necessary, the mark can be made on the Y-axis or on both axes. • In a histogram, it is necessary that the adjacent rectangles be attached to each other. Therefore, if the given classes are not continuous, it is necessary to make them continuous e.g.; if the classes are 2 to 5, 6 to 9, 10 to 13,…. It should be as 1.5 to 5.5, 5.5 to 9.5, 9.5 to 13.5…
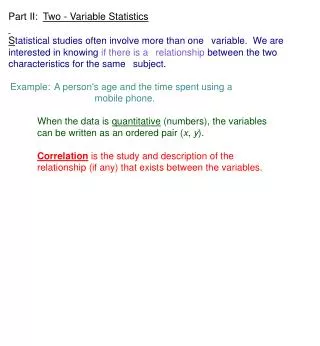
Statistical graph 5: Scatter plot: The scatter pot shows the relationship between two factors of the experiment. It displays the relationship between two data's.
WHAT IS A CARTOGRAM? A cartogram is a colored map that gives a graphical representation of statistical data. It is used for an immediate view of a phenomenon or behavior.